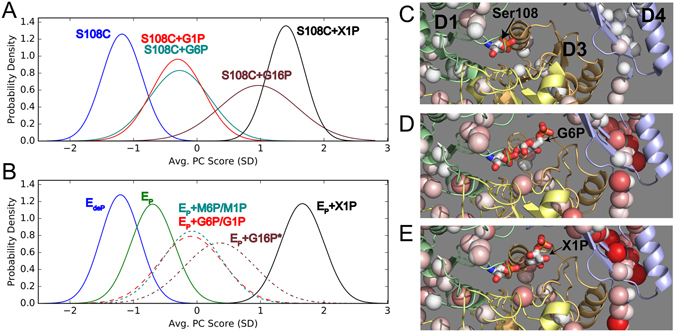
Figure 7.

CONCISE analysis of PMM/PGM complexes and mixtures. (A,B) Probability densities of different states are plotted in units of standard deviations of average PC scores for (A) PMM/PGM(S108C) and (B) wt PMM/PGM. The dashed curves in (B) symbolize mixtures of phosphosugars present with the minor phosphosugar listed second. * refers to the likelihood of the G16P added to wt enzyme being transformed in part to G6P and G1P. (C–E) Generally increasing amide CSPs accompany the progression of increasing average PC scores. The CSPs are calculated relative to EP using Eq. 1. Increasing CSPs of (B) EdeP, (C) EP+G6P, G1P (major, minor sugars), and (D) EP+X1P states are symbolized by increased radius and red tint of the spheres plotted on the crystal structures with PDB accession codes of 1K35, 1P5G, and 2H5A, respectively.
