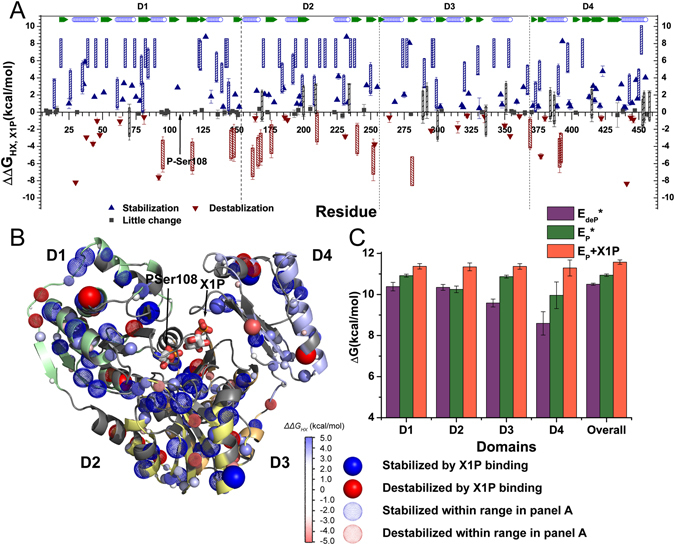
Figure 8.

X1P binding protects more sites from hydrogen exchange than it exposes. (A) Differences of free energies of hydrogen exchange (ΔΔG HX, X1P) subtract the free energies for EP from those of EP+X1P. Triangles indicate cases where k ex was measured in both EP and EP+X1P forms. Hatched bars represent cases in which k ex in one state is unmeasurable and estimated to lie in the range 1 s−1 > k ex > 4 × 10⁻³ s−1. (B) The ΔΔG HX, X1P values are mapped onto the crystal structure of EP+X1P (PDB:2H5A). Amide groups protected from HX by X1P binding are marked by blue spheres. Amide groups destabilized (mobilized) by X1P binding have red spheres. Dotted spheres correspond to residues with uncertainty ranges marked as hatched bars in (A). The magnitudes of ΔΔG HX, X1P are symbolized by the color gradient, as well as by the radii of the spheres. (C) Estimated folding stabilities are plotted for each domain and the enzyme as a whole, not only for EP+X1P from this study, but also for EP and EdeP compared in ref. 10.
