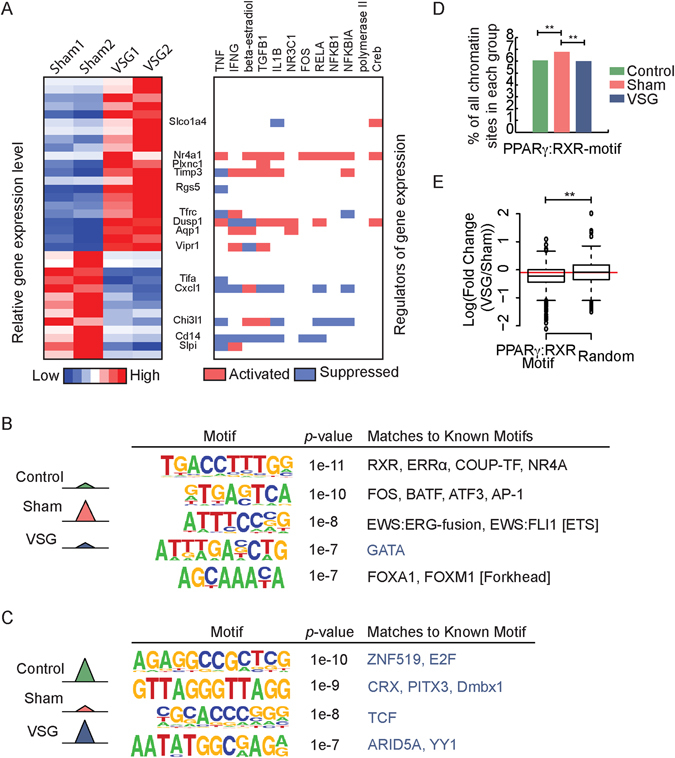
Figure 5.

Upstream regulators altered by VSG. (A) Heatmap of differentially express genes between Sham and VSG (left), and upstream regulators from Ingenuity Pathways Analysis (right). (B and C) Identified motifs from reversible chromatin sites that are more (B) or less (C) accessible in Sham compared to Control and VSG. Numbers in parentheses represent p-values of enrichment of motif occurrence in the given set of sequences compared to background, and the percentage of sequences with the motif. (D) Percentage of accessible chromatin site in each group that contained PPARγ:RXR motif (**Indicates p < 0.01, Fisher’s exact test). (E) Fold change (VSG vs Sham) of FAIRE read counts within chromatin sites contain PPARγ:RXR motifs or random chromatin sites (**Indicates p < 0.01, Wilcoxon’s rank-sum test).
