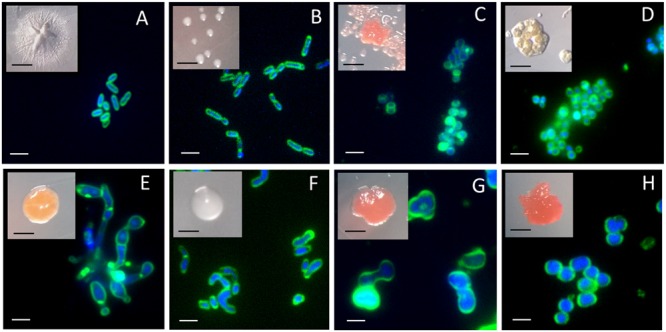
FIGURE 4.

Colonies and fluorescence microscopy images of isolates obtained from the Hennequin point sample on diluted NB media. (A) Isolate Ap38E; (B) Isolate Ap45E; (C) Isolate Ap25E. Similar images were obtained for isolate Ap46E and therefore are not shown; (D) Isolate Ap42E; (E) Isolate Ap44E; (F) Isolate Ap36E; (G) Isolate Ap29E. Similar images were obtained with isolate Ap43E and therefore are not shown; (H) Isolate Ap32E. Membrane were stained with FM1-43 and DNA were stained with DAPI. Black scale bars: 1 mm. White scale bars: 2 μm.
