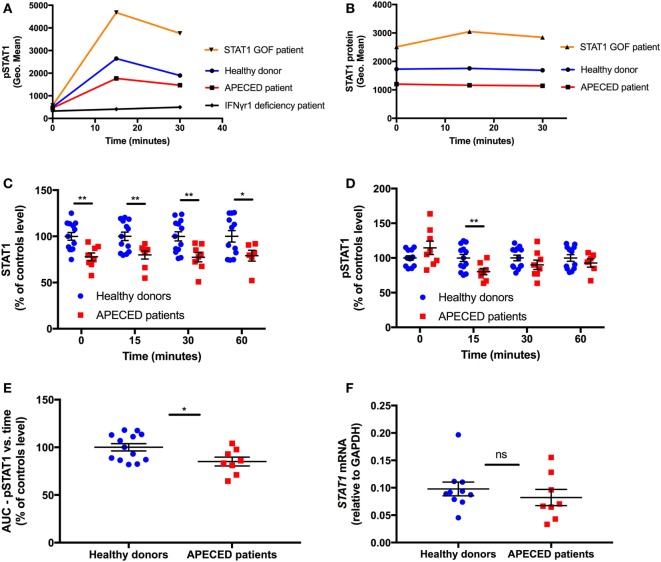
Figure 1.
Autoimmune regulator deficiency results in a decrease in STAT1 protein levels in human monocytes. (A) Representative depiction of pSTAT1 level at rest and up to 30 min after interferon (IFN)-γ stimulation in CD14+ cells of a STAT1 gain-of-function (GOF) patient (orange), an autoimmune polyendocrinopathy-candidiasis-ectodermal dystrophy (APECED) patient (red), a patient with the autosomal dominant form of IFN-γR1 deficiency (black) and a healthy donor (blue) (B) Representative depiction of STAT1 protein level at rest and up to 30 min after IFN-γ stimulation in CD14+ cells of a STAT1 GOF patient (orange), an APECED patient (red), and a healthy donor (blue). Protein and phosphorylation levels are expressed in geometric mean of fluorescence (Geo. Mean), as measured by flow cytometry. STAT1 total protein (C) and pSTAT1 (D) levels in CD14+ cells of APECED patients (n = 8; red dots) and healthy donors (n = 13; blue dots) at rest (time 0) and up to 60 min after IFN-γ stimulation. Total protein and phosphorylation levels are expressed in % of the same-day control average values, for each time point—0, 15, 30, and 60 min, separately. (E) Area under the curve of CD14+ cells STAT1 phosphorylation vs. time in APECED patients (n = 8; red dots) and healthy donors (n = 13; blue dots). (F) STAT1 mRNA level, relative to glyceraldehyde-3-phosphate dehydrogenase, in peripheral blood mononuclear cells of healthy donors (n = 10) and APECED patients (n = 8) at rest. ns, not significant. *p < 0.05; **p < 0.01, by t-test. Quantitative data represent mean ± SEM.

