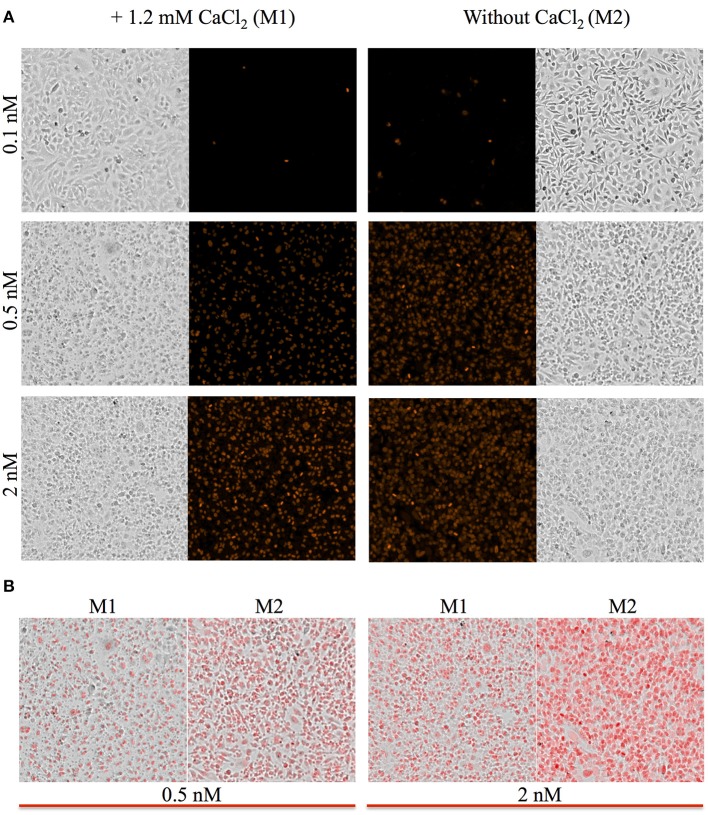
Figure 3.
Representative images of HeLa cells. Phase contrast and fluorescence images of HeLa cells were acquired with a 4X objective located within the plate reader at the end of the kinetic assay corresponding to time the point 30 min. (A) Cells were incubated in M1 or M2 with the indicated concentrations of LLO. All fluorescence intensities are presented using the same intensity scale. (B) Overlay of phase contrast and fluorescence images are presented to facilitate the comparison between the M1 and M2 experimental conditions.

