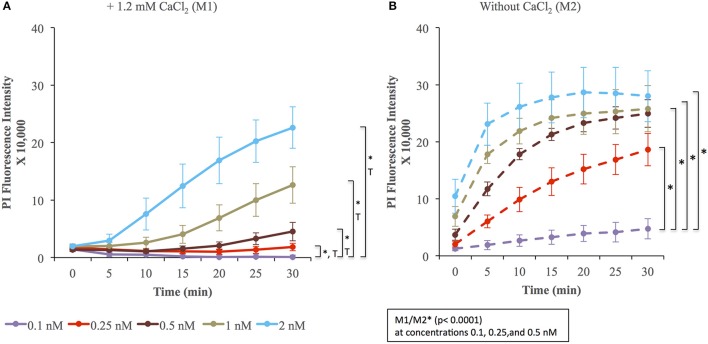
Figure 5.
Membrane wounding and repair in muscle cells. C2C12 cells were exposed to the indicated concentrations of LLO in M1 (A) and M2 (B) supplemented with 30 μM PI for 30 min at 37°C in the plate reader. Fluorescence intensities were measured every 5 min. The baseline fluorescence level, at each time point in M1 (A) and M2 (B), of control cells incubated without LLO were subtracted from the values obtained with cells incubated with LLO. Data are the average fluorescence intensities expressed in arbitrary unit ± standard error of the mean (S.E.M.) of four independent experiments. Statistical analyses correspond to the trend comparison (T, p < 0.0001, except for concentration 0.25 nM p = 0.02) and the mean fluorescence intensities averaged across all time points (*, p < 0.0001). Those analyses compared the different concentrations of LLO in M1 (A) or in M2 (B) and compared data obtained in M1 vs. M2 (M1/M2) at a given concentration of LLO (showed in the squared box). Statistical analyses are also recapitulated in Tables 3A–C.

