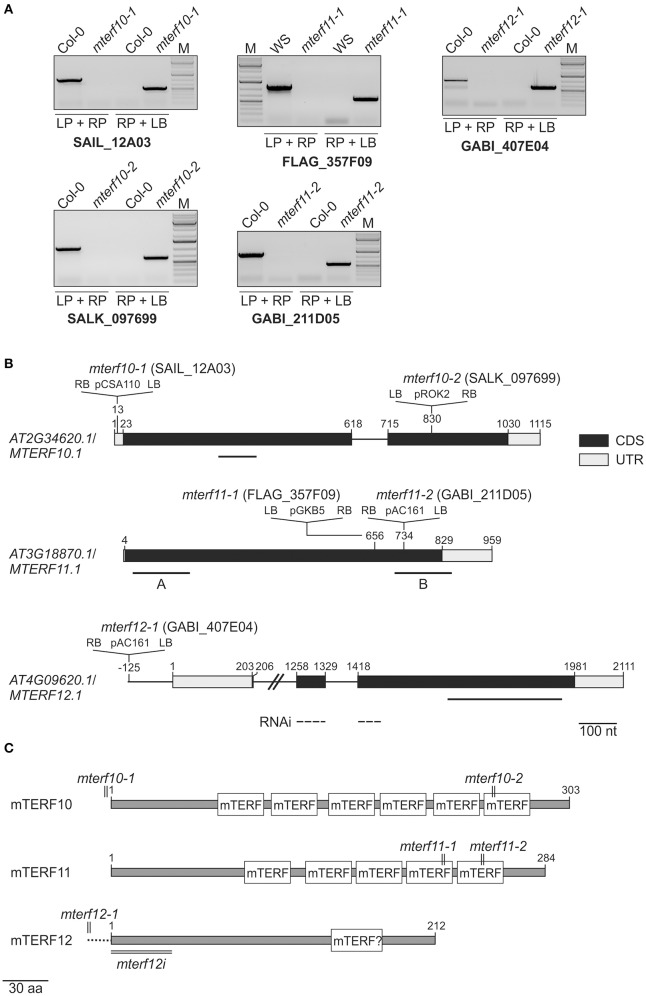
Figure 2.
Identification of mterf10, mterf11 and mterf12 T-DNA insertion mutants, and generation of MTERF12 RNAi lines. (A) Confirmation and identification of homozygous T-DNA insertions in the different mterf mutant lines. The combination of the gene-specific left and right primers (LP and RP) was used for amplification of sequences around the T-DNA insertion. The combination of RP and T-DNA left border primer (LB) was used for the verification of the T-DNA insertion. (B) Schematic representation and T-DNA tagging of the MTERF10 (AT2G34620), MTERF11 (AT3G18870), and MTERF12 (AT4G09620) loci. Exons (black boxes), introns (black lines) and the 5′ and 3′ UTRs (gray boxes) are shown. Numbers are given relative to the transcription start site of the gene loci. Locations and orientation of T-DNA insertions are indicated, as deduced from RP + LB PCR products shown in (A) which were subsequently sequenced. Note that the insertions are not drawn to scale. Furthermore, the location of the MTERF12 RNAi-directed sequence is indicated as a dashed line. (C) Schematic representation of mTERF10, mMTERF11, and mTERF12 proteins. The numbers and locations of mTERF domains are shown as white boxes. The relative positions of T-DNA and RNAi tagging are indicated.

