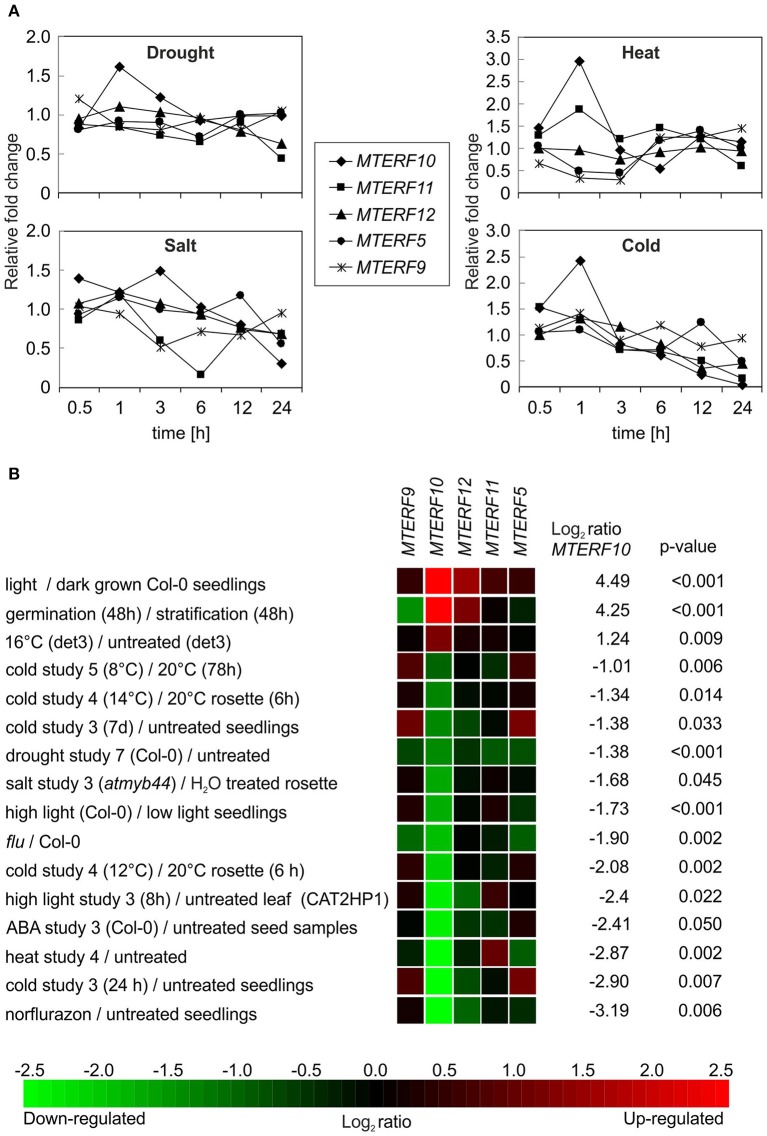
Figure 5.
In silico analyses of changes in levels of MTERF transcripts in response to abiotic stresses. (A) MTERF transcript levels were extracted from the Arabidopsis eFP Browser (http://bar.utoronto.ca/efp/cgi-bin/efpWeb.cgi) with “Abiotic Stress” as a data source (Winter et al., 2007). Plant material from stress-treated and control plants was analyzed over a time course of 24 h. Here, the expression values are reported relative to the corresponding transcript levels in control conditions. (B) The Genevestigator Perturbations Tool (https://genevestigator.com/gv; Hruz et al., 2008) was applied to all available A.thaliana microarrays in combination with the 2-fold change filter and a p-value of < 0.05. Shown here is a selection of conditions related to abiotic stresses. Conditions were ordered according to the magnitude of the relative change in MTERF10 mRNA (from high to low). An overview of all transcriptional responses of MTERF10, MTERF11, and MTERF12 to perturbations can be found in Supplementary Figures S1–S3.

