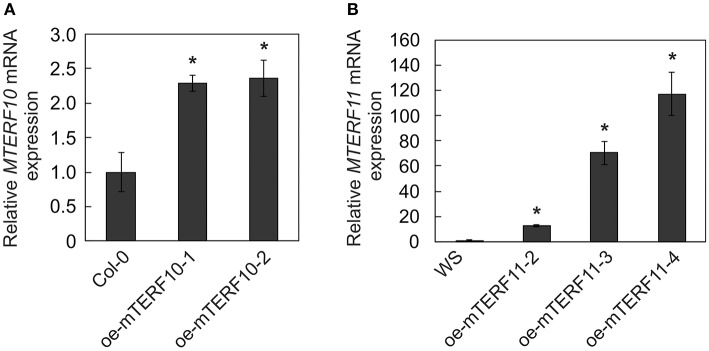
Figure 8.
MTERF10 (A) and MTERF11 (B) transcript levels in Col-0 lines overexpressing MTERF10 (oe-mTERF10) and WS lines overexpressing MTERF11 (oe-mTERF11), respectively. Transcript levels were determined by real-time PCR analysis. Expression values are reported relative to the corresponding transcript levels in Col-0. The results were normalized with respect to the expression level of At4g36800 (RCE1). Bars indicate standard deviations. Statistically significant differences (t-test; p < 0.05) between Col-0 and oe-mTERF10 lines and WS and oe-mTERF11 lines, respectively, are indicated by an asterisk.

