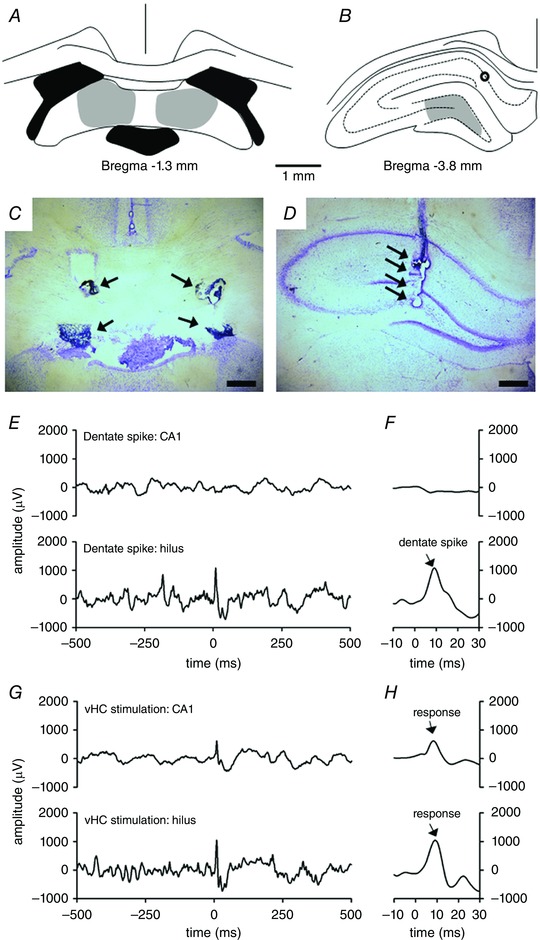
Figure 1. Stimulation electrodes were placed in the ventral hippocampal commissure (vHC) (A and C) and recording electrodes were placed in the hilus (B and D) to study the role of dentate spikes (E and F) in learning with the help of electrical stimulation of the hippocampus via the vHC (G and H).

A, stimulation electrodes were placed in the vHC (grey shading). Black indicates ventricles. B, recording electrodes were targeted to the hilus (grey shading). Black circle indicates placement of a recording electrode in the CA1. C, example photomicrograph of stimulation electrode placement. Arrows point to electrode tips. D, example photomicrograph of recording electrode placement in the hilus. Arrows point to electrode tips. Horizontal scale bars in C and D are 500 μm in length. E and F, examples of spontaneous local‐field potentials (LFPs) illustrating a dentate spike (starting at time point 0) recorded from the CA1 (upper panel) and hilus (lower panel) in one rat belonging to the yoked control group. F is a magnification of E. Note the absence of a major deflection in CA1 during a dentate spike in hilus. G and H, LFPs recorded during vHC stimulation (at time point 0, bipolar pulse of 0.2 ms in total duration). H is a magnification of G. Note the clear response in CA1 when compared to the spontaneously generated dentate spike illustrated in E and F. [Color figure can be viewed at wileyonlinelibrary.com]
