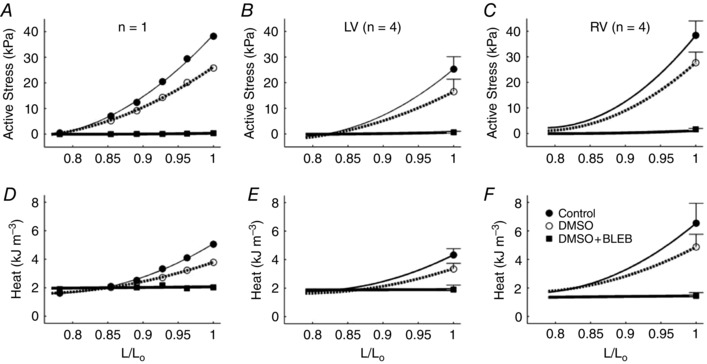
Figure 3. Active stress and heat per twitch as functions of muscle length from a single trabecula.

A and D, active stress (A) and heat per twitch (D) as functions of muscle length from a single representative trabecula. B, C, E and F, stress–length and heat–length regression relations describing individual muscles from the different interventions were averaged within the LV group (B and E) and the RV group (C and F). Mean ± SEM values at optimal length were superimposed appropriately in panels B, C, E and F.
