
Figure 13. Wortmannin inhibits whole cell Ca2+ currents in OT neurons while having no effect in VP neurons.
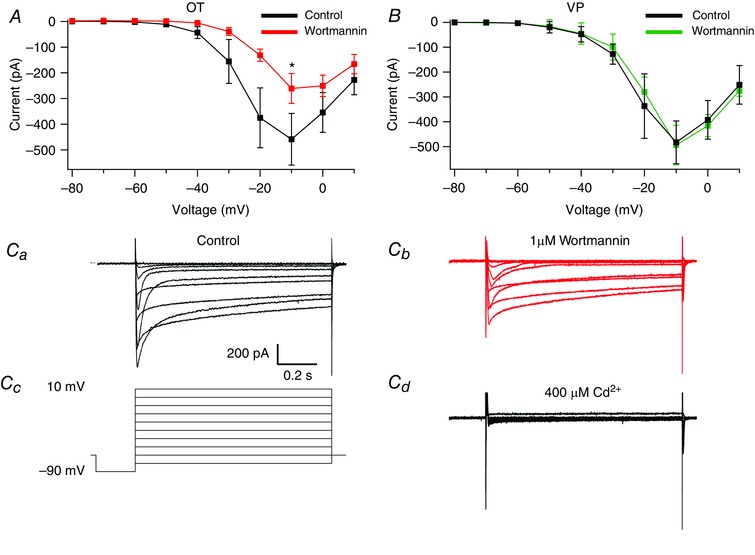
Ca2+ currents were isolated and subsequently measured before and after wortmannin (1 μm). I–V curves were plotted from steady‐state measurements of these currents. A, I–V curve of Ca2+ currents before and after wortmannin in OT neurons. Comparison at the highest amplitude steady‐state current (−10 mV) revealed a significant difference (* P < 0.05). B, I–V curve of Ca2+ currents before and after wortmannin in VP neurons. C, example traces from a single OT neuron of isolated whole cell Ca2+ currents generated by voltage steps from −90 mV to +10 mV under control conditions (Ca) and after 1 μm wortmannin application (Cb). The voltage protocol (Cc) and 400 μm Cd2+ (Cd) are shown for the same cell. [Color figure can be viewed at wileyonlinelibrary.com]