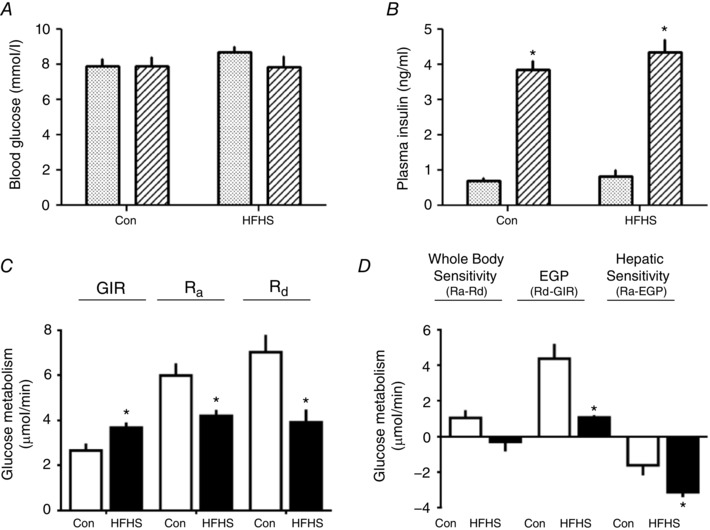
Figure 3. The effect of HFHS feeding on maternal glucose‐insulin dynamics on day 19 of pregnancy.

Blood glucose (A) and plasma insulin concentrations (B) in the basal (stippled columns) and hyperinsulinaemic (striped columns) periods of the hyperinsulinaemic‐euglycaemic clamp, rates of glucose infusion (GIR), appearance (R a) and disappearance (R d) measured directly (C) or derived indirectly as differences in rates (D) from tritiated glucose infusion and the clamp protocol (whole body and hepatic insulin sensitivity and EGP) in control dams (Con, n = 6, white columns) and HFHS (n = 6, black columns) at D19 of pregnancy. *Significant difference in (B) in concentration from the basal period (P < 0.01, paired t test), within each period of the clamp. *Significant differences in (C) and (D) in rates between diets (P < 0.05, unpaired t test).
