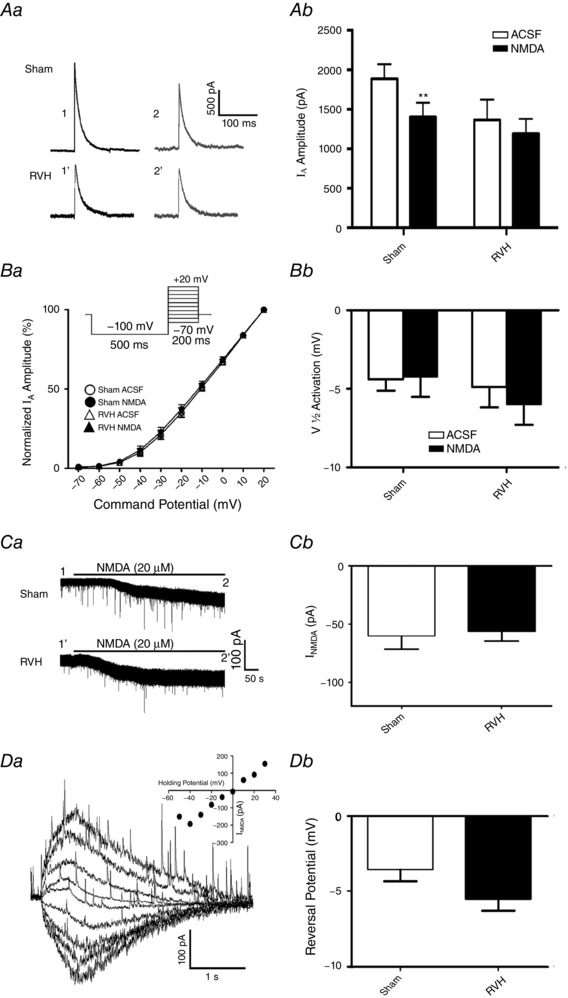
Figure 1. NMDAR activation by exogenous NMDA mediates a smaller I A inhibition in MNCs from RVH rats.

Aa, representative example of I A (−20 mV command step) before (1) and during (2) NMDA (20 μm) bath application in MNCs from a sham and RVH rat. Time points 1 and 2 correspond to the same ones as shown in Ca. Ab, summary data of mean I A amplitude before (open bars) and during (filled bars) NMDAR activation in sham and RVH rats (n = 8/group). Ba, plots of mean normalized I A current amplitude vs. the command potential fitted with Boltzmann functions in MNCs from sham and RVH rats before and during NMDA application (n = 8 per group). Inset: protocol used to evoke I A. Bb, summary data of mean I A half‐activation potentials in MNCs from sham and RVH rats before and during NMDA application. Ca, bath‐applied NMDA (20 μm) induced an inward shift in holding current (I NMDA) in both MNCs from sham and RVH rat. Time points 1 and 2 correspond to the time points where I A was evoked in Aa. Cb, summary data of mean I NMDA magnitude in MNCs from sham and RVH rats before and during NMDA application (n = 8 per group). Da, representative example in a MNC from a sham rat of focally evoked NMDA currents (picospritzer, 100 μm, 4 p.s.i., 500 ms), while holding the neuron at varying holding potentials (from −50 to +30 mV in 10 mV increments). Inset: I–V plot of the evoked I NMDA in the representative cell. Db, summary data of the mean I NMDA reversal potential in MNCs from sham and RVH rats (n = 5 and 6, respectively). ** P < 0.01.
