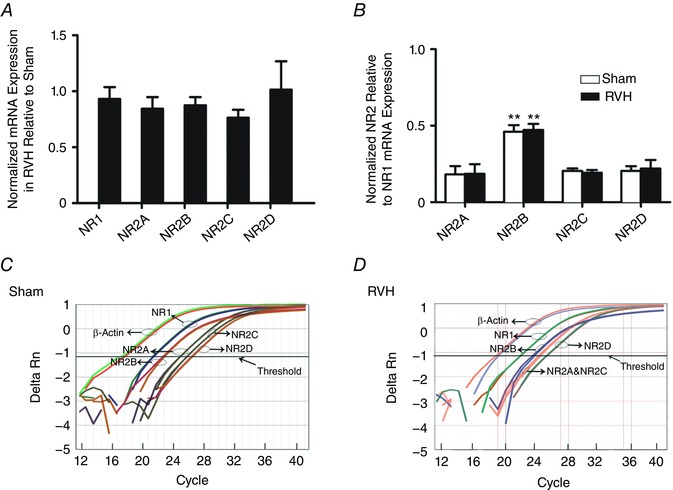
Figure 2. NMDAR subunit mRNA expression in the SON of sham and RVH rats.

A, summary data of normalized mRNA expression for NR1 and NR2A–D subunits in the SON of RVH rats relative to sham rats (n = 7 per group). B, summary data of normalized mRNA expression of NR2A–D relative to NR1 in sham and RVH rats (n = 7 per group). C and D, representative examples of quantitative real‐time PCR amplification curves for NR1 and NR2A–D, tested against the reference gene β‐actin in the SON of a sham (C) and an RVH (D) rat. The cycle numbers at which the respective lines crossed the x‐axis are their threshold values (C T). Note that NR1 mRNA crossed the x‐axis at an earlier cycle number than all NR2 subunits, and that the NR2B mRNA crossed the x‐axis at an earlier cycle number than the other NR2 subunits, indicating highest expression for NR1 followed by the NR2B subunit. ** P < 0.001 vs. all other subunits within each group. [Color figure can be viewed at wileyonlinelibrary.com]
