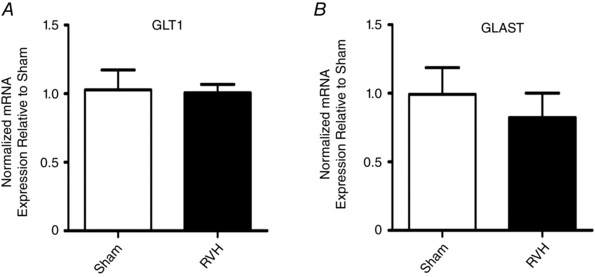
Figure 5. GLT1 and GLAST glutamate transporter mRNA expression in the SON of sham and RVH rats.

Summary data of normalized mRNA expression for GLT1 (A) and GLAST (B) in the SON of RVH rats relative to sham rats (n = 9 and 13, respectively). *** P < 0.001 vs. sham.
