
Figure 2. Muscle mTORC2 signalling at rest and during treadmill running in Ric mKO mice.
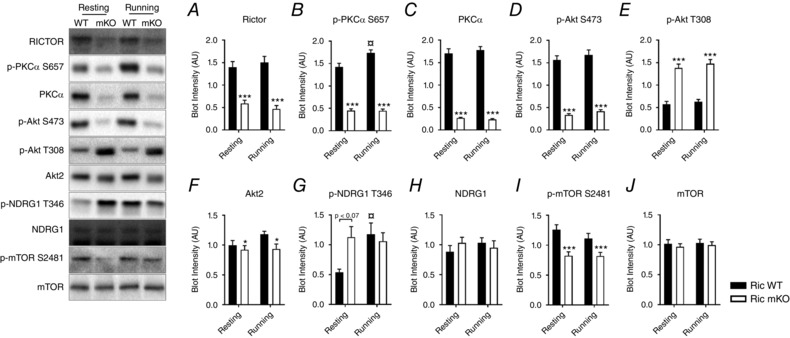
Representative Western blots and quantitative analysis of the indicated phosphorylation sites and total proteins in gastrocnemius muscle lysates from Ric WT and Ric mKO mice that were either resting or running (n = 9–13). *** P < 0.001, * P < 0.05 are main effects of genotype (Ric WT vs. Ric mKO); for p‐PKCα S657 and p‐NDRG1 T346 an interaction was detected by two‐way ANOVA (P = 0.0084 and P = 0.0304, respectively) and the following differences were determined by Tukey's post hoc tests: ¤ P < 0.05 difference between Ric WT resting and Ric WT running. Values are means ± SEM.