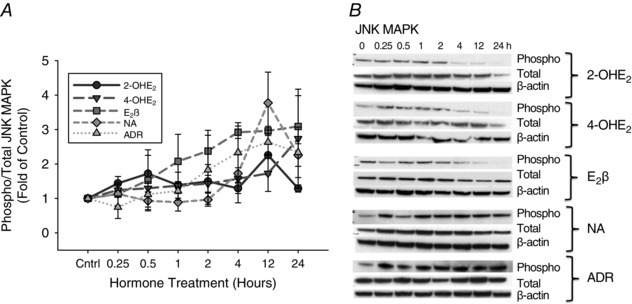
Figure 3. Time course responses of JNK MAPK phosphorylation.

A, phosphorylation of JNK MAPK in P‐UAECs upon treatment with 2‐OHE2, 4‐OHE2, E2β, noradrenaline (NA) and adrenaline (ADR) (all 0.1 nm) over the course of 24 h. Phosphorylation of JNK increased over time with 2‐OHE2 and 4‐OHE2, E2β, NA and ADR. Graphs represent the means ± SEM (Student‐Newman‐Keuls test, P < 0.05 was considered statistically significant). B, representative blots of phosphorylated, total JNK and β‐actin (n = 3).
