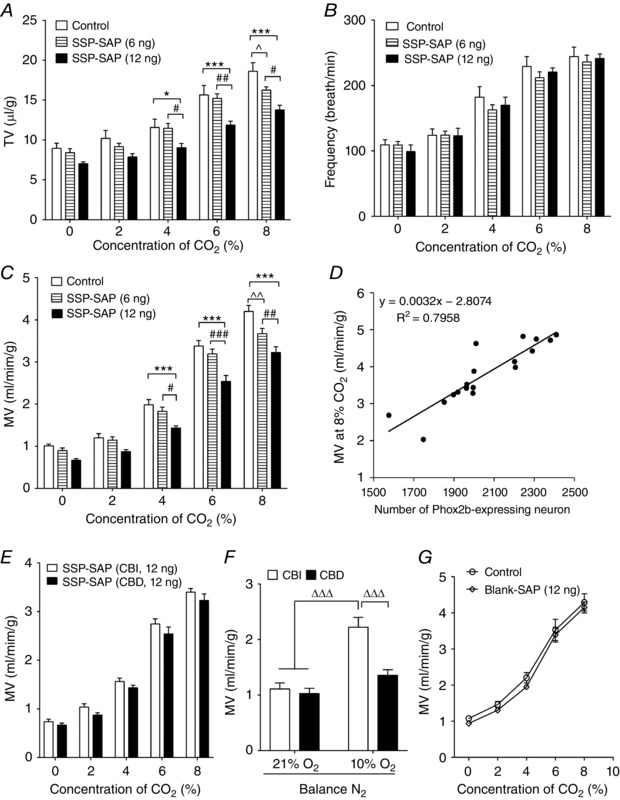
Figure 3. Loss of Phox2b‐expressing neurons attenuates HCVR.

A–C, pooled data showing the effects during wakefulness of bilateral injections of SSP‐SAP on TV (A), respiratory frequency (B) and MV (C) at different CO2 concentrations in the inspired air (balance O2). * P < 0.05, *** P < 0.001, vs. control; # P < 0.05, ## P < 0.01, ### P < 0.001, vs. 6 ng SSP‐SAP; ^ P < 0.05, ^^ P < 0.01, vs. control, two‐way ANOVA with Tukey's post hoc test (n = 13 for control, n = 13 for 6 ng, n = 12 for 12 ng). D, linear regression analysis of hypercapnic ventilation and the number of Phox2b‐containing cells. The number of Phox2b cells was counted from eight consecutive sections of each control and SSP‐SAP (12 ng)‐injected mice (n = 9 for each group). MV was measured during exposure to 8% CO2 in corresponding mice. The scatter chart was plotted using MV against the number of Phox2b cells and a trending line was added. r 2 = 0.7958, P < 0.001 by ANOVA. E, CBI and CBD mice exhibited similar increases in MV during exposure to CO2 after injection of 12 ng of SSP‐SAP (n = 12 for both). P > 0.05 for all by two‐way ANOVA with Bonferroni's test. CBI, carotid body innervated; CBD, carotid body denervated. F, CBD mice displayed a blunted ventilation during exposure to 10% O2 compared to CBI (n = 8 for CBI, n = 7 for CBD). ΔΔΔ P < 0.001 by two‐way ANOVA with Tukey's post hoc test. G, bilateral injections of 12 ng of Blank‐SAP are without effects on MV.
