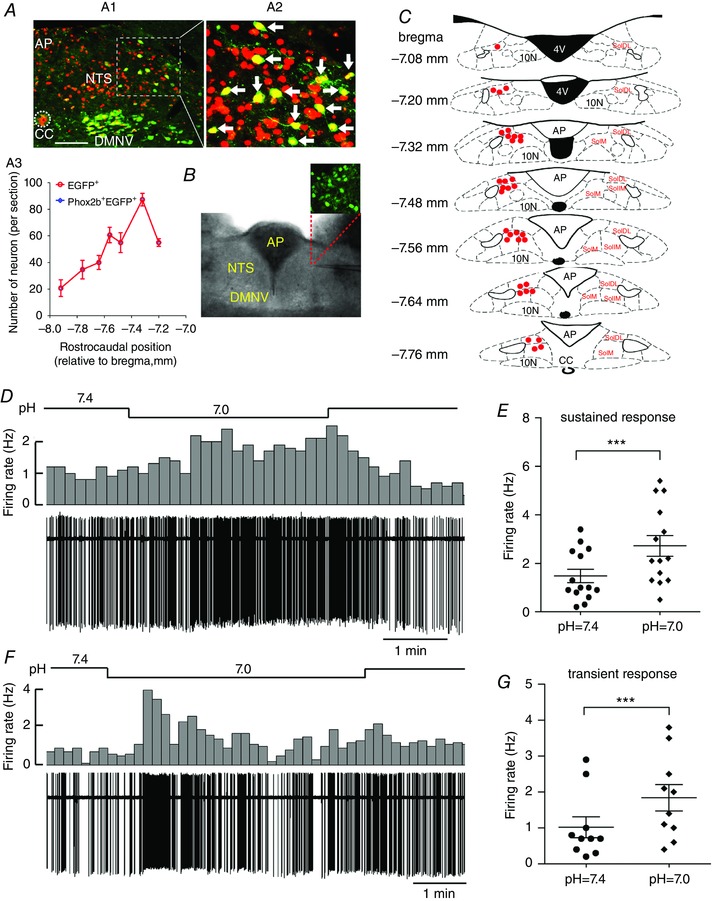
Figure 5. A subgroup of Phox2b‐expressing neurons are sensitive to H+ .

A, each EGFP‐expressing neuron is immunoreactive to Phox2b. A1, immunofluorescence photomicrograph showing the distribution of EGFP+ (green), Phox2b+ (red) and Phox2b+EGFP+ neurons (yellow, merged) in the NTS, DMNV and AP in a coronal section from a Phox2b‐EGFP transgenic mouse. The inset is enlarged in (A2). Scale bar = 100 μm. A2, as indicated by white arrows, all of the EGFP+ neurons are immunoreactive to Phox2b. A3, rostrocaudal distribution of EGFP+ and Phox2b+EGFP+ neurons from three mice. B, image (bottom) of an acute brainstem slice containing NTS, with magnified fluorescence image (top) of EGFP‐expressing neurons. C, distribution of pH‐sensitive neurons in the NTS. After patch clamp recording, the location of each pH‐sensitive EGFP‐expressing neuron was pinpointed in the schematic sketch of the NTS based on the atlas of the Mouse Brain in Sterotaxic Coordinates (Paxinos & Franklin, 2003). Red dots indicate the location of pH‐sensitive cells. D and F, typical traces showing sustained (D) and transient (F) increases in firing rate during bath acidification in Phox2b‐expressing neurons from Phox2b‐EGFP mice. Firing rate histograms (top traces, 10 s bins) derived from cell‐attached voltage clamp recordings (bottom traces). E and G, group data demonstrating sustained (E) (n = 14) and transient (G) (n = 10) increases in average firing rate during bath acidification in Phox2b‐expressing neurons. ***P < 0.001 by a two‐tailed paired t test. SolDL, dorsolateral part of the NTS; SolIM, intermediate part of NTS; SolM, medial part of the NTS. [Color figure can be viewed at wileyonlinelibrary.com]
