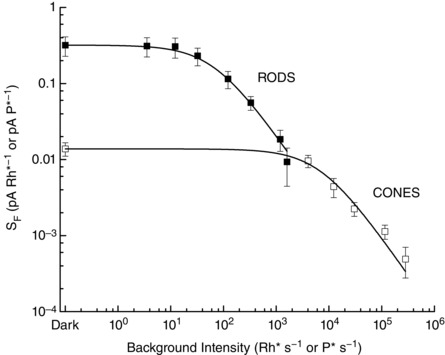
Figure 6. Weber–Fechner relations for lamprey rods and cones.

Backgrounds and flashes were at 500 nm for rods and 600 nm for cones; intensities are given separately in units of Rh* or Rh* s−1 for rods and P* or P* s−1 for cones. Sensitivity (S F) was calculated by dividing the peak amplitude of responses within the linear range (r < 0.3r max) by the flash intensity in Rh* or P*. Data have been fitted with eqn (4) with values of I 0 of 67 Rh* s−1 for rods and 7070 P* s−1 for cones.
