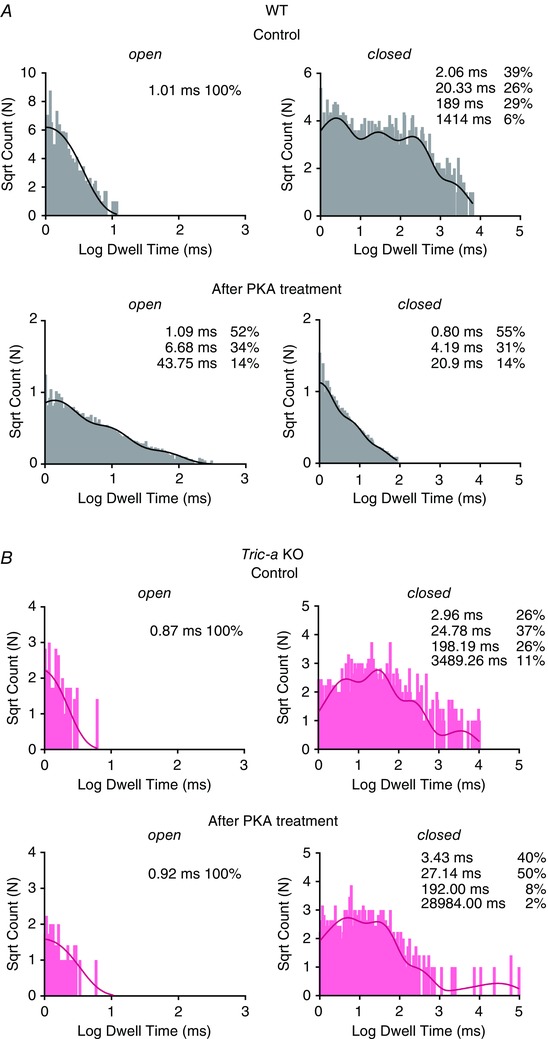
Figure 7. Effects of PKA‐dependent phosphorylation on open and closed lifetime distributions.

The open and closed lifetime distributions and pdfs for a typical single RyR1 channel from WT (grey) (A) and Tric‐a KO mice (pink) (B) in the presence of 10 μm cytosolic Ca2+ as sole channel activator before and after 10 min of treatment with 10 U of PKA. The best fits to the data were obtained by the method of maximum likelihood and the resulting time constants and percentage areas are shown.
