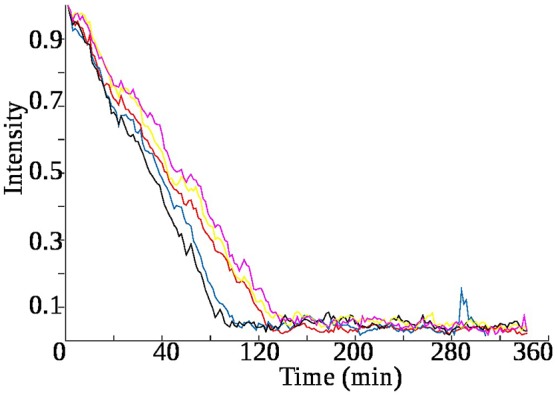
Figure 9.

Rate of consumption of glucose varies with the amount of face tonic present in the sample. Each time glucose is 0.01% while face tonic is varied as : red–0%, black–0.1%, blue–0.2%, yellow–0.3%, pink–0.4%. In each case the trend line is obtained by taking the average of the peak integration values of three glucose cross peaks present at coordinates : (3.46–4.6, 3.39–4.6, 3.23–4.6 ppm) in the z-TOCSY spectra.
