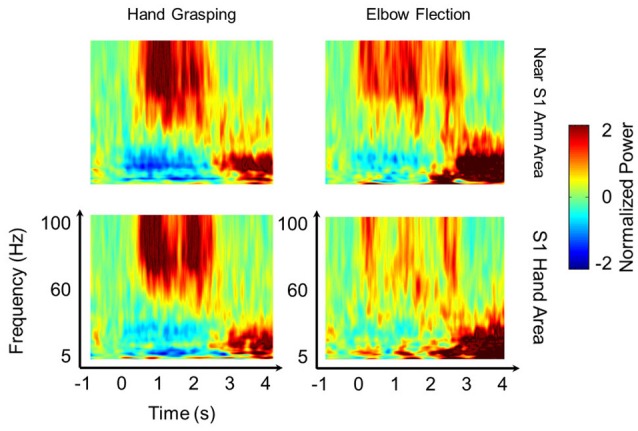
Figure 2.

Spatio-temporal pattern of HG power. Representative time-frequency plots during hand grasping (left) and elbow flexion (right) in near the S1 arm area (top) and in the S1 hand area (bottom) from Subject 2. The results indicate that S1 HG activities show distinct power changes and show the difference not only in somatotopy but also in temporal dynamics between the two movement types. The 60 Hz power line noise was removed after frequency-by-frequency normalization.
