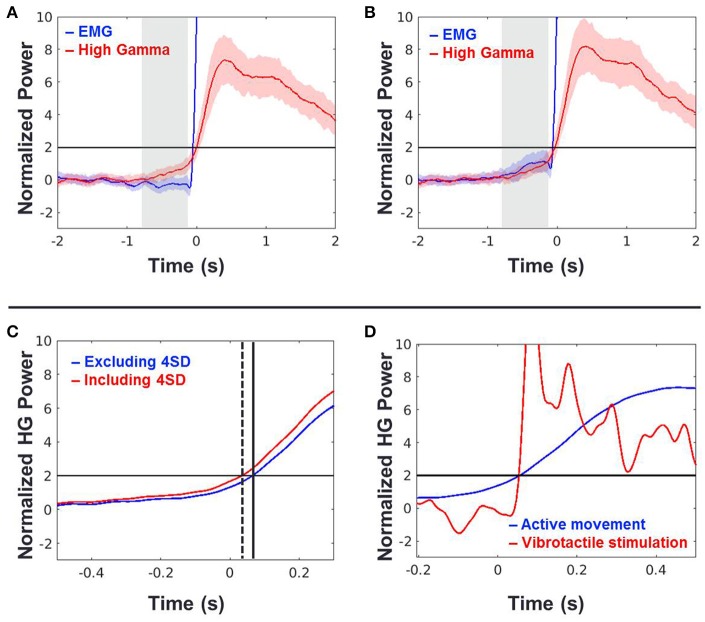
Figure 5.
(A,B) Time traces of grand-averaged EMG (blue) and HG power (red) across all movement types, sessions and subjects when the 4 SD trials were excluded (A) and included (B). Black horizontal lines indicate the chance levels (2 SD) of the EMG and HG power increases. Shaded areas with the color corresponding to the respective conditions denote 95% confidence intervals. Shaded areas shown in gray indicate periods of −0.75 to −0.1 s of the movement onset used in the further analysis. (C) Time shift of HG onset between (A; blue) and (B; red) conditions. Time t = 0 indicates the movement onset time-point determined by the EMG signal. Dashed and solid vertical lines indicate the HG onset time-points of (A,B) conditions, respectively. (D) HG power time traces of (A; blue) and vibrotactile stimulation (red). Time t = 0 indicates the movement onset or vibrotactile stimulus onset. Note that the HG onset timings of these two conditions are virtually the same.

