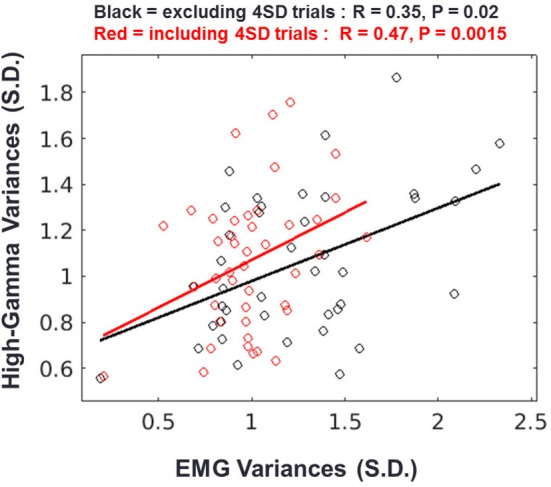
Figure 6.

Relationship between HG and EMG fluctuations during the pre-movement period. Result of regression analysis when the 4 SD trials are excluded (black) or included (red). Each circle represents the standard deviations of the HG power and EMG signal from one session. Solid lines indicate the regression slopes from the two conditions.
