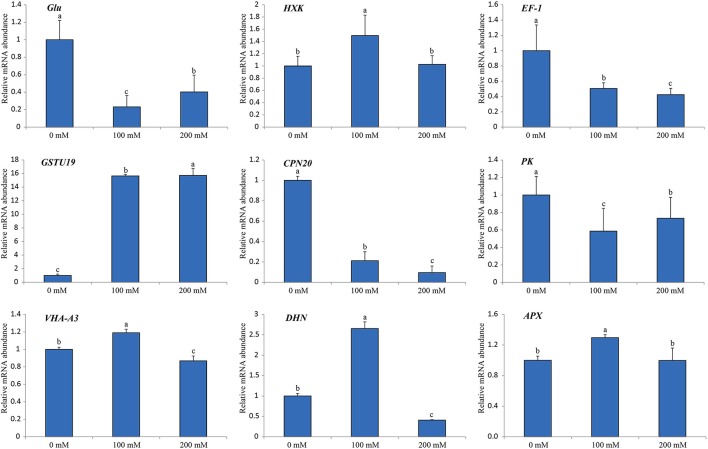
Figure 7.
Relative mRNA expression analysis using RT-qPCR on nine protein species under diverse salt treatments. The expression level in the untreated samples (0 mM) was set to a value of 1. Each bar shows the mean ± SE (n = 3). Letters above the columns indicate significant differences at p < 0.05 according to Duncan's multiple range test.

