Figure 2.
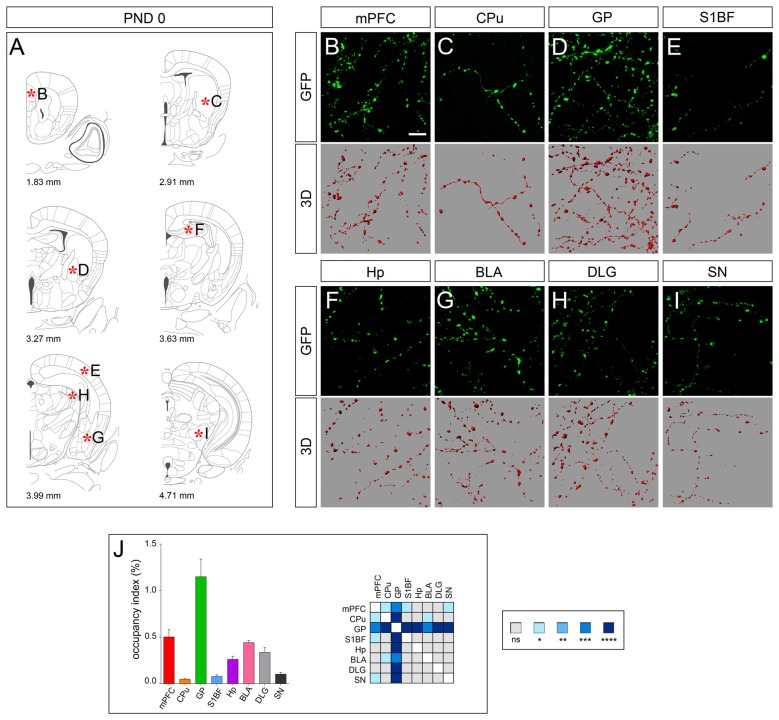
3D-reconstruction and analysis of serotonergic fibers in post-natal day 0 (PND 0) brain. (A) Coronal tables adapted from the atlas of developing mouse brain showing the precise anatomical localization of the region analyzed (Paxinos et al., 2007), as indicated by asterisks corresponding to high magnification images in (B–I). (B–I) Representative high power confocal images of GFP-immunostained serotonergic fibers of a single analyzed block, and their 3D-reconstructions. (J) Histogram comparing the occupancy index across the regions, and heatmap showing color-coded p-values of the differences in occupancy index among the analyzed regions. Data are expressed as mean ± SEM. Statistical significance was calculated with one way ANOVA with multiple comparisons and Tukey’s p-values correction. ns: p > 0.05; *p < 0.05; **p < 0.01; ***p < 0.001; ****p < 0.0001. Scale bar: 10 μm. mPFC, medial Prefrontal Cortex; GP, Globus Pallidus; CPu, Caudate/Putamen; S1BF, Primary Somatosensory Cortex, Barrel Field; BLA, Basolateral Amygdala; Hp, Lacunosum moleculare layer of the dorsal CA1 of hippocampus; DLG, Dorsal Lateral Geniculate Nucleus; SN, Substantia Nigra.

