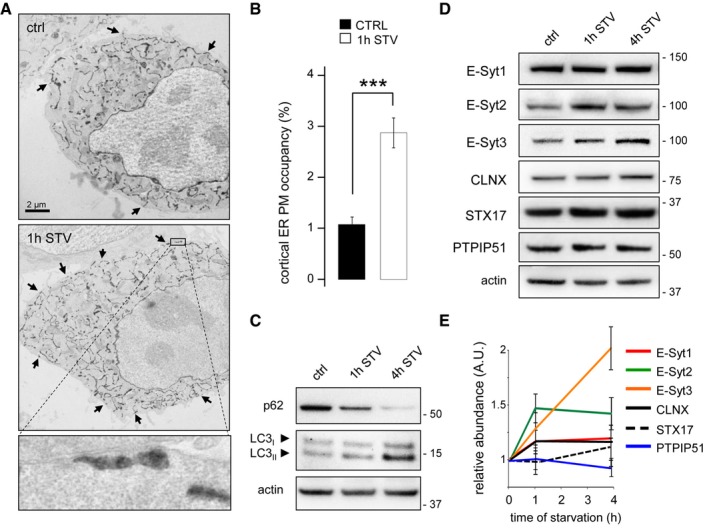
Figure 1. Starvation increases ER‐PM contact sites density.

-
AElectron micrographs of HeLa cells grown under complete medium conditions (control, ctrl) or starved for 1 h (1 h STV). HeLa cells were transfected with the ER luminal marker ssHRP‐myc‐KDEL (which enables ER identification via an electron‐dense (dark) HRP reaction) to allow detection of ER‐PM contact sites (black arrows). Scale bar, 2 μm. Representative images from one of three independent experiments are shown.
-
BQuantification of ER‐PM contact sites visualized in electron micrographs with 20 cells analysed per condition in each of three experiments. Means ± s.e.m. are plotted. ***P < 0.001, unpaired two‐tailed t‐test.
-
C–EHeLa cells were grown under control and starvation conditions for 1 and 4 h. Representative Western blots of lysates for (C) p62 and lipidated LC3 and (D) E‐Syts, calnexin (CLNX), STX17, and PTPIP51 are shown. Actin was used as a loading control. (E) Quantification of Western blots from three independent experiments. Means ± s.e.m. are plotted.
