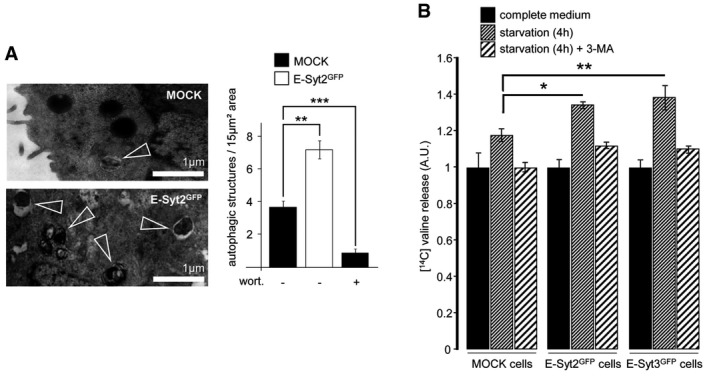
An electron micrograph of GFP‐E‐Syt2‐expressing HeLa cells starved for 1 h, showing an increased number of autophagic structures (arrowheads) compared to starved control cells. Scale bar, 1 μm. Wortmannin (wort, 100 nM) was used as a negative control, and autophagic structures were counted in 15 μm2 areas (n = 10 cells).
Proteolysis analysis showing an increased protein degradation rate in GFP‐E‐Syt2‐ and GFP‐E‐Syt3‐expressing cells (n = 3). 3‐methyladenine (3‐MA) was used at 10 mM.
Data information: Means ± s.e.m. are plotted. *
P < 0.05, **
P < 0.01, ***
P < 0.001, unpaired two‐tailed
t‐test.

