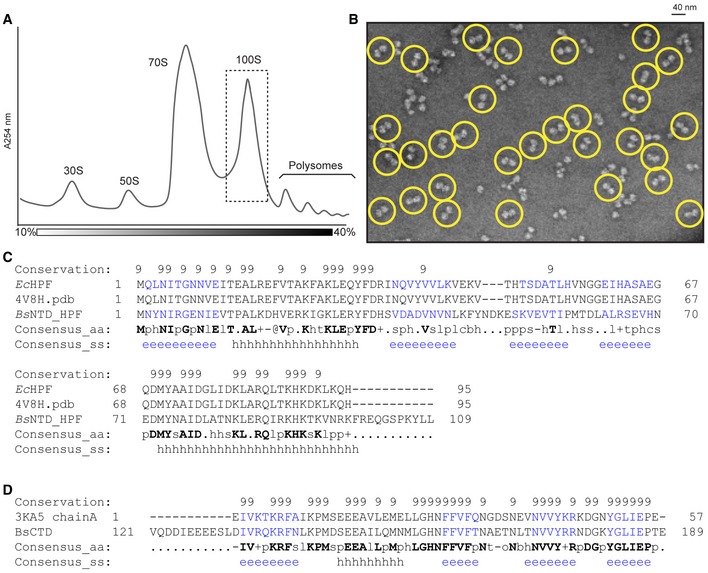
Sucrose density gradient profile of B. subtilis extract from late log phase cells, with 30S, 50S, 70S, 100S, and polysome peaks indicated.
Negative stain electron microscopy images of purified Bs100S from (A), with selected 70S dimers circled in yellow.
PROMALS3D (Pei
et al,
2008) sequence alignment of
BsHPF‐NTD with
Escherichia coli HPF (PDB 4V8H)(Polikanov
et al,
2012) that was used to generate the homology model for
BsHPF‐NTD.
PROMALS3D (Pei
et al,
2008) sequence alignment of
BsHPF‐CTD with
Clostridium acetobutylicum HPF‐CTD (
CaCTD; PDB ID 3KA5) that was used to generate the homology model for
BsHPF‐CTD.
Data information: In (C) and (D), fully conserved residues are indicated with “9” and are bold in the Consensus_aa, whereas similar residues are indicated with a “+”. Consensus_ss indicates β‐sheet (e) and helical (h) regions.

