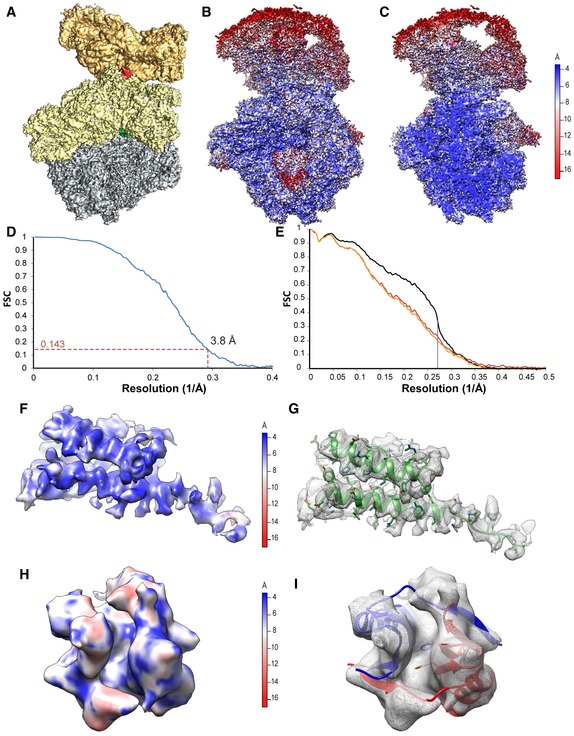
Figure EV3. Resolution of 70S‐A in the Bs70S‐30S subcomplex.

-
AOverview of the Bs70S‐30S subcomplex with 30S‐A (yellow), 50S‐A (gray), and 30S‐B (orange), as well as BsHPF‐NTD (green) and BsHPF‐CTD (red).
-
B, COverview (B) and transverse section (C) of the Bs70S‐30S subcomplex colored according to the local resolution, as calculated using ResMap (Kucukelbir et al, 2014).
-
DFourier‐shell correlation curve of the refined cryo‐EM map, indicating the average resolution of 70S‐A in the Bs70S‐30S subcomplex is 3.8 Å.
-
EFit of models to maps. FSC curves calculated between the refined model and the final map (black), with the self‐ and cross‐validated correlations in orange and red, respectively. Information beyond 4 Å was not used during refinement and preserved for validation.
-
F–IMap density for the (F, G) BsHPF‐NTD and (H, I) BsHPF‐CTD, which are (F, H) colored according to the local resolution, as calculated using ResMap (see Materials and Methods), or (G, I) shown as a gray mesh with molecular models (G) for BsHPF‐NTD (green) or (I) BsHPF‐CTD for 70S‐A (red) and 70S‐B (blue), using the same respective view as in (F, H).
