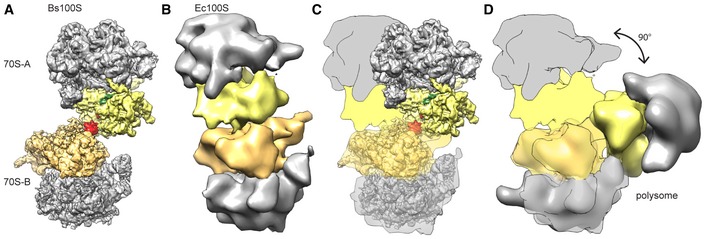
Figure 6. Spatial organization of Bs100S, Ec100S, and polysomes.

-
A–DComparison of the 70S‐A and 70S‐B monomer arrangement in (A) Bs100S, compared with (B, C) Ec100S (Ortiz et al, 2010) and (D) Escherichia coli polysomes (Brandt et al, 2009). The 30S‐A (yellow), 30S‐B (orange), 50S (gray), BsHPF‐NTD (green), and BsHPF‐CTD (red) are colored for reference, and schematics of the Ec100S are presented in (C) and (D) for ease of comparison.
