
Figure EV4. Assessment of overall mitochondrial function and muscle health in mOPA1/FGF21 DKO mice.
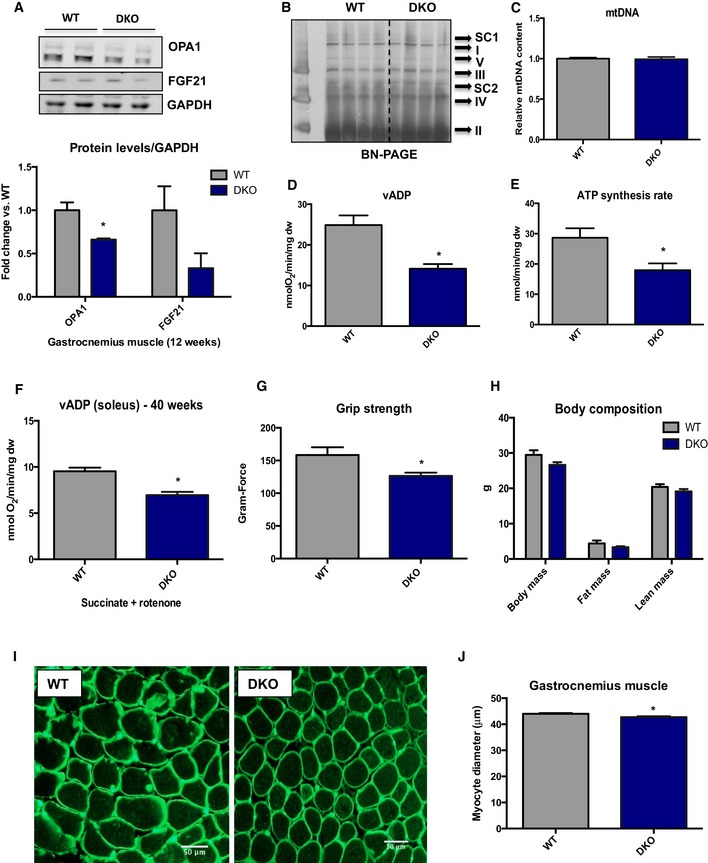
- Representative immunoblots and densitometric quantification of OPA1 normalized to GAPDH in gastrocnemius muscle from 12‐week‐old WT and mOPA1/FGF21 KO mice (n = 3).
- BN‐PAGE in gastrocnemius muscle of 12‐week‐old mice (n = 4).
- mtDNA copy number in gastrocnemius muscle of 12‐week‐old mice (n = 3–4).
- Maximally stimulated succinate‐supported mitochondrial respirations in soleus from 20‐week‐old mice (n = 4–6).
- Succinate‐supported ATP synthesis rates in soleus from 20‐week‐old mice (n = 4–5).
- Maximally stimulated succinate‐supported mitochondrial respirations in soleus from 40‐week‐old mice (n = 5).
- Measurements of grip strength in 40‐week‐old mice (n = 3).
- Body weight and body composition in 20‐week‐old WT and DKO mice (n = 5–9).
- Cross sections of gastrocnemius muscle from 20‐week‐old mice stained with wheat‐germ agglutinin (WGA). Scale bar = 50 μm.
- Measurements of muscle fiber diameter in gastrocnemius muscle from 20‐week‐old mice (n = 3).
tPData information: Data are expressed as means ± SEM. Significant differences were determined by Student's t‐test, using a significance level of P < 0.05. (*) Significantly different vs. WT mice. Source data are available online for this figure.