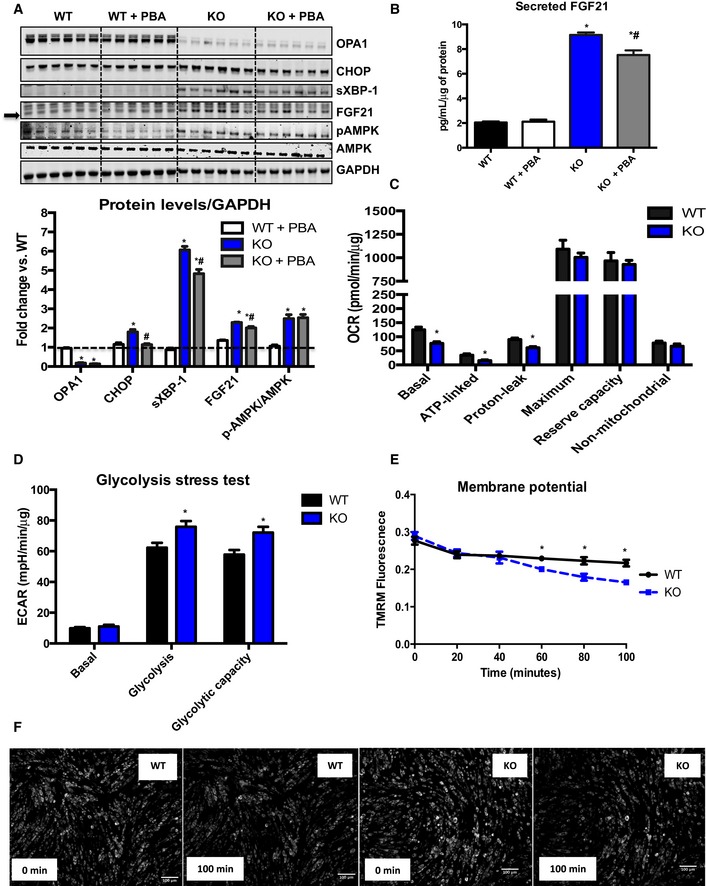
Representative immunoblots in primary myotubes obtained from OPA1fl/fl mice and infected with Ad‐GFP or Ad‐Cre. Cells were treated with either vehicle (PBS) or PBA for 3 days. Densitometric analysis of immunoblots of OPA1, CHOP, XBP‐1, and FGF21 normalized to GAPDH protein levels and of pAMPK/AMPK ratios (n = 6).
Secreted FGF21 levels measured in the media (n = 6).
Measurement of oxygen consumption rates (OCR) in primary myotubes 3 days after adenoviral infection (n = 8–10 technical replicates).
Measurements of extracellular acidification rates during a glycolysis stress test in primary myotubes 3 days after adenoviral infection (n = 8–10 technical replicates).
TMRM fluorescence over time after treatment with H2O2 (n = 3 technical replicates).
Representative pictures of primary myotubes stained with TMRM at times 0 (immediately after addition of H2O2) and 100 min after H2O2 treatment. Scale bar = 100 μm.
Data information: Data are expressed as means ± SEM. Significant differences were determined by Student's
t‐test (C–E), using a significance level of
P < 0.05; (*) significantly different vs. WT cells or by ANOVA followed by Tukey multiple comparison test (A, B), using a significance level of
P < 0.05 for the studies in which cells were treated with PBA. (*) vs. WT; (#) vs. KO.
Source data are available online for this figure.