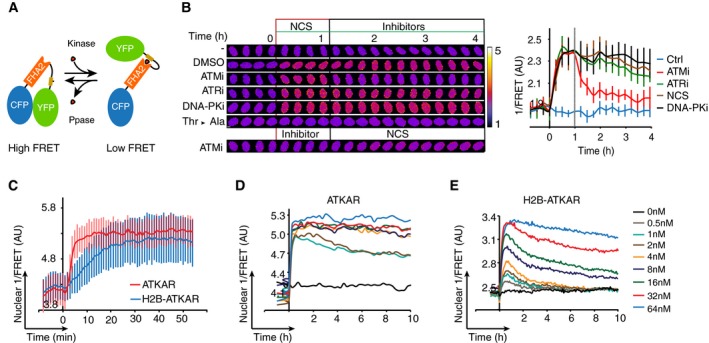
Schematic outline of FRET‐based probe. Phosphorylation of designated sequence (beige) leads to interaction with the phospho‐binding FHA2 domain (red). This is considered to lead to a conformation change that separates the fluorophores (blue and green), resulting in a decrease in FRET.
Change in FRET‐ratio of H2B‐ATKAR after neocarzinostatin (NCS) addition depends on ATM. Time‐lapse sequence (left) or quantification of 1/FRET (right) of U2OS cells expressing H2B‐ATKAR. Time point 0 indicates addition of 20 nM NCS, and time point 1 indicates addition of KU60019 (10 μM, ATMi), VE821 (1 μM, ATRi), or NU7026 (10 μM, DNAPKi). Thr‐Ala indicates alanine replacement of the designated phosphoacceptor in H2B‐ATKAR. Graph shows average and SD of at least 15 cells. Scale bars: 8 μm. Heat map indicates 1/FRET (AU).
Quantification of 1/FRET of a mixed population of H2B‐ATKAR‐ and ATKAR‐expressing U2OS cells after addition of NCS (5 nM). H2B‐ATKAR and ATKAR expressing cells were identified by the localization pattern of the expressed constructs. Graph shows average and SD of median pixel value of at least seven cells. Time point 0 indicates addition of NCS.
ATKAR signal reaches saturation at ˜4 nM NCS. Quantification of 1/FRET of U2OS cells expressing ATKAR, treated with the indicated NCS concentrations. Graph shows average 1/FRET of ≥ 10 U2OS cells/condition.
H2B‐ATKAR signal responds in a dose‐dependent manner to NCS addition and is reversed over time. Graph shows average 1/FRET of ≥ 10 U2OS cells/condition.

