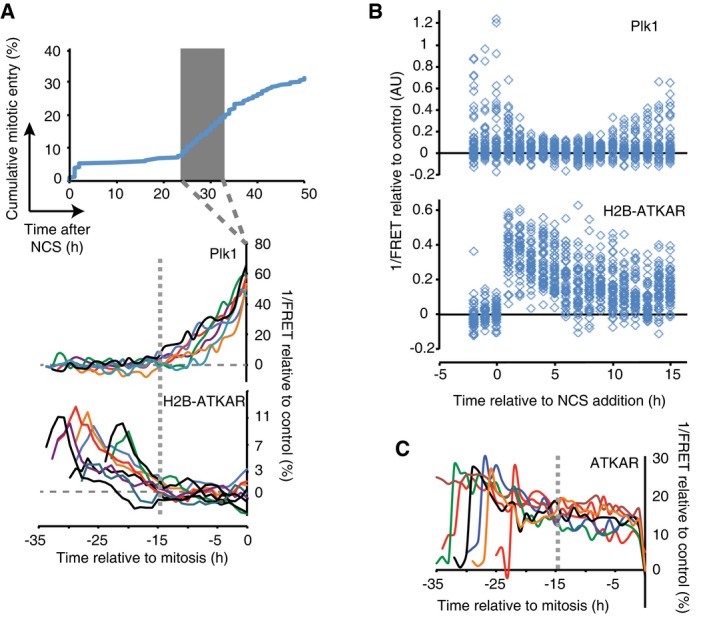
Figure 2. Activation of Plk1 correlates with dephosphorylation of a chromatin‐bound ATM substrate.

- Reversal of H2B‐ATKAR correlates with resumption of Plk1 activity during cell cycle restart. A mixed population of U2OS cells expressing H2B‐ATKAR or Plk1 FRET probe were treated with 2 nM NCS, and mitotic entry was followed over time (top). Cells entering mitosis 24 to 33 h after NCS addition (gray rectangle) were synchronized in silico on mitosis and 1/FRET of individual cells was quantified (bottom). Gray dotted vertical line indicates 15 h before mitosis.
- Resumption of Plk1 activity correlates with reversal of H2B‐ATKAR phosphorylation. A mixed population of RPE cells expressing H2B‐ATKAR or Plk1 FRET probe were transfected with p53 siRNA and treated with 8 nM NCS. 1/FRET was quantified of at least 41 cells per time point for each probe. H2B‐ATKAR or Plk1 FRET were recognized by their nuclear or whole‐cell localization. Each mark corresponds to one cell.
- ATKAR phosphorylation is sustained until mitotic entry during spontaneous checkpoint recovery. U2OS cells expressing ATKAR were followed during treatment with NCS (2 nM) and 1/FRET of cells spontaneously recovering 24–33 h later were plotted as in (A). Each line represents a single cell synchronized in silico upon mitotic entry. Gray dotted vertical line indicates 15 h before mitosis.
