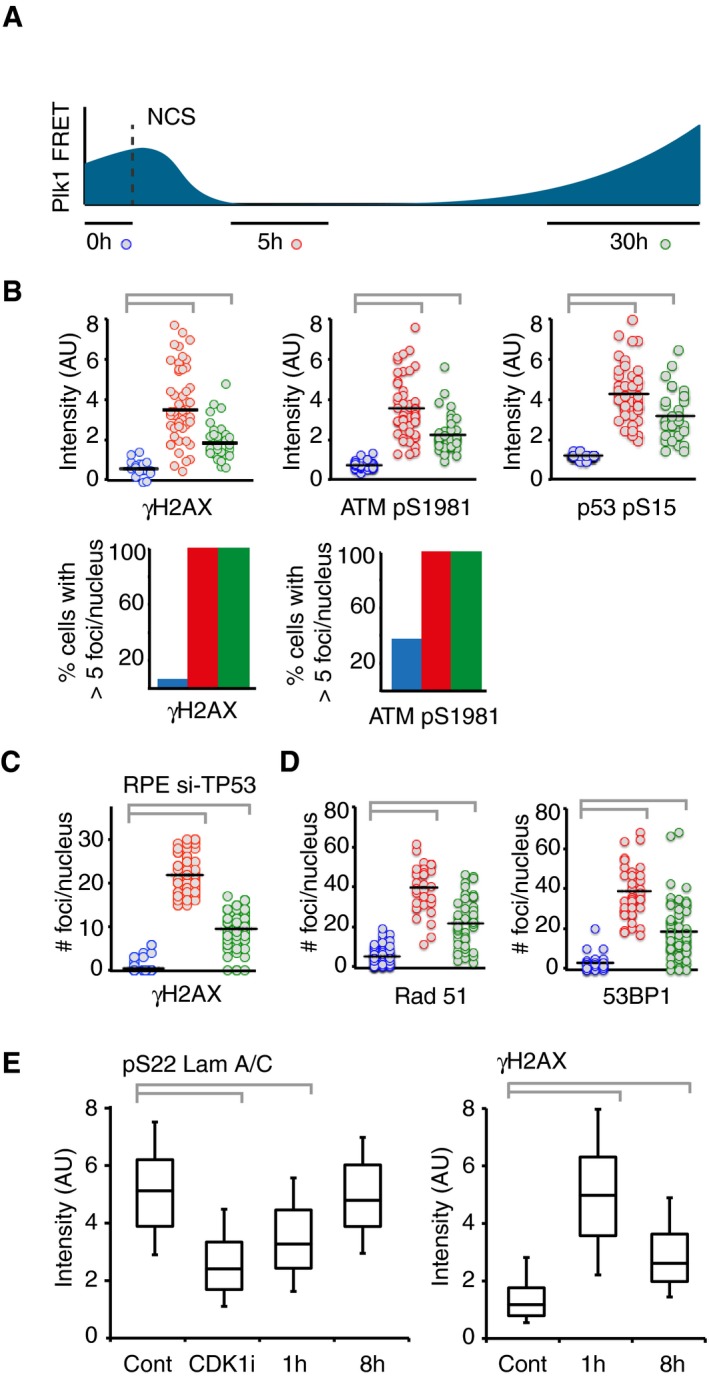
DNA damage foci are present after Plk1 re‐activation.
Schematic of approach. U2OS cells expressing Plk1 FRET probe were treated with NCS (2 nM). Before fixation at indicated time points, 1/FRET was followed in individual live cells to detect undamaged G2 cells (0 h, blue), G2 arrested cells without detectable Plk1 activity (5 h, red), and recovering G2 cells with increasing Plk1 activity (30 h, green). After fixation, the corresponding cells were identified both based on position and morphology.
Quantification of immunofluorescence of cells followed as in (A). Graphs show signal intensity or percentage of cells with nuclear foci detected by indicated antibodies.
RPE cells expressing Plk1‐FRET were treated with siRNA for TP53 and followed as in (A and B). Times were adjusted to 4.5 h (red) and 17 h (green). Graph shows quantification of γH2AX foci.
Quantification of immunofluorescence of cells followed as in (A and B). Graphs show amount of nuclear foci detected by indicated antibodies.
Cdk1 re‐activation in presence of γH2AX phosphorylation. RPE p53−/− cells were pulsed with EdU and treated or not (Cont, Cdk1i) with 8 nM NCS; 1 or 8 h later, cells were fixed and EdU‐negative, 4n DNA content cells (assessed by DAPI intensity) were analyzed for pS22 Lam A/C or γH2AX using quantitative immunofluorescence. RO‐3306 (Cdk1i) was added for 2 h before fixation. The box plots represent the 90th, 75th, 50th, 25th, and 10th percentiles of at least 270 G2 cells per condition.
‐test. (B–D) Black bar indicates median and circles correspond to individual cells.

