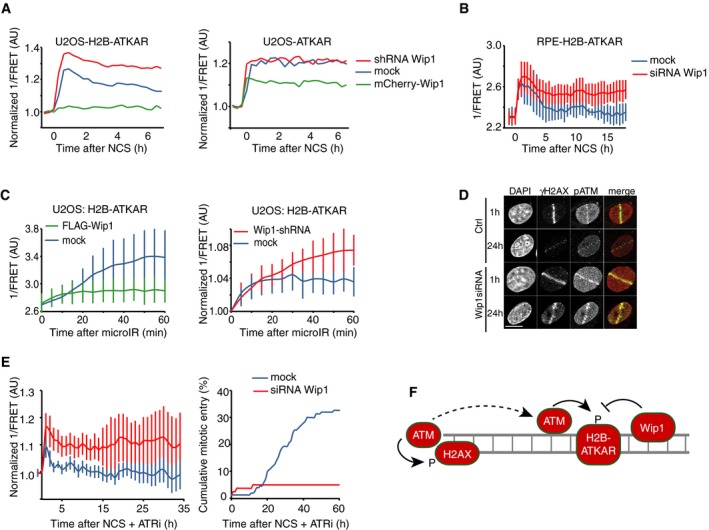
Quantification of 1/FRET of mixed populations of U2OS cells expressing H2B‐ATKAR or ATKAR. Cells were mock transfected or transfected with Wip1 shRNA or mCherry‐Wip1 for 48 h and treated with NCS (8 nM). Graph shows average of ≥ 8 cells.
Quantification of 1/FRET of RPE‐H2B‐ATKAR transfected with control or Wip1 siRNA treated with NCS (8 nM). Graph shows average of ≥ 8 cells; error bars indicate SD.
Wip1 influences the spread of H2B‐ATKAR 1/FRET change. U2OS‐H2B‐ATKAR cells were transfected with mock (blue), FLAG‐Wip1 (green), or Wip1 shRNA (red) and microirradiated with 364 nm laser. 1/FRET distal to the damaged area was quantified. Graph shows average and SD of at least five cells.
pS1981‐ATM is present throughout chromatin and counteracted by Wip1. U2OS cells were transfected with control or Wip1 siRNA, fixed after 1 or 24 h after microirradiation with 364 nm laser, and co‐stained for γH2AX and pS1981‐ATM. Scale bar: 15 μm.
Wip1‐depleted cells do not enter mitosis in presence of ATRi. 1/FRET (left) and cumulative mitotic entry (right) were measured in U2OS cells expressing H2B‐ATKAR transfected with mock or Wip1 shRNA treated with NCS (4 nM) and ATRi. Graph shows average of 10 cells. Error bars indicate SD.
Schematic model. Rather than DNA damage foci, H2B‐ATKAR signal detects ATM/Wip1 balance throughout chromatin.

