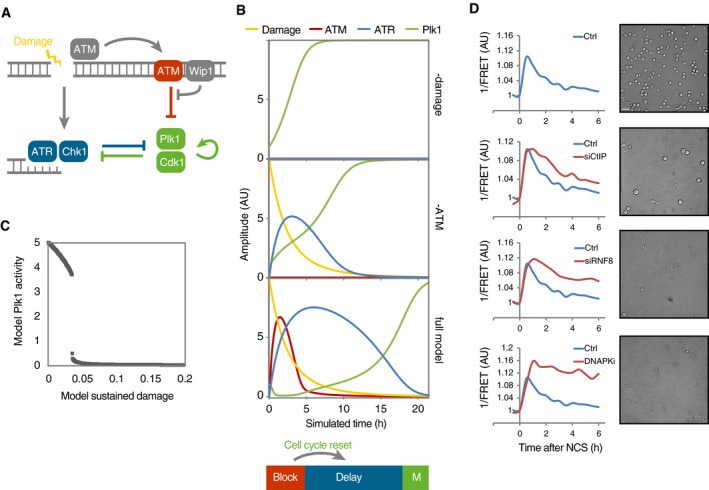
Figure 7. ATM activity at chromatin determines the minimal duration of a checkpoint.

- Schematic outline of simplified mathematical model. Arrows represent differential equations.
- Simulation of model in the absence of damage (top) or ATM (middle) or containing all components (bottom). ATM activity on chromatin functions as a barrier that blocks Plk1 activity. Wip1 efficiently counteracts ATM‐mediated phosphorylations, which restricts ATM activity throughout chromatin to high damage levels. After reversal of the barrier, cell cycle signaling eventually overcomes ATR‐dependent activities, despite the presence of unrepaired DNA breaks. Due to the reset cell cycle activities (compare Plk1 and ATR in middle and lower graphs), a delay is introduced before ATR activities are overcome and mitosis occurs.
- Cell cycle progression depends on a threshold level of damaged DNA. Simulation of optimized model (Fig EV3C), set so that after the initial DNA damage 2, a proportion of damage is not repaired. Graph shows simulation to steady state for the indicated range of sustained DNA damage levels.
- Interference with DNA repair processes delays dephosphorylation of H2B‐ATKAR and mitotic entry. U2OS cells expressing H2B‐ATKAR were treated with indicated siRNAs or DNA‐PK inhibitor (NU7441, 2 μM), and 1/FRET was quantified in 10 cells after addition of 8 nM NCS (left). In parallel, mitotic cells were visualized by microscopy 24 h after treatment with 2 nM NCS and nocodazole (right). Scale bar: 50 μm.
