. 2015 Sep 11;6(12):7097–7104. doi: 10.1039/c5sc02467f

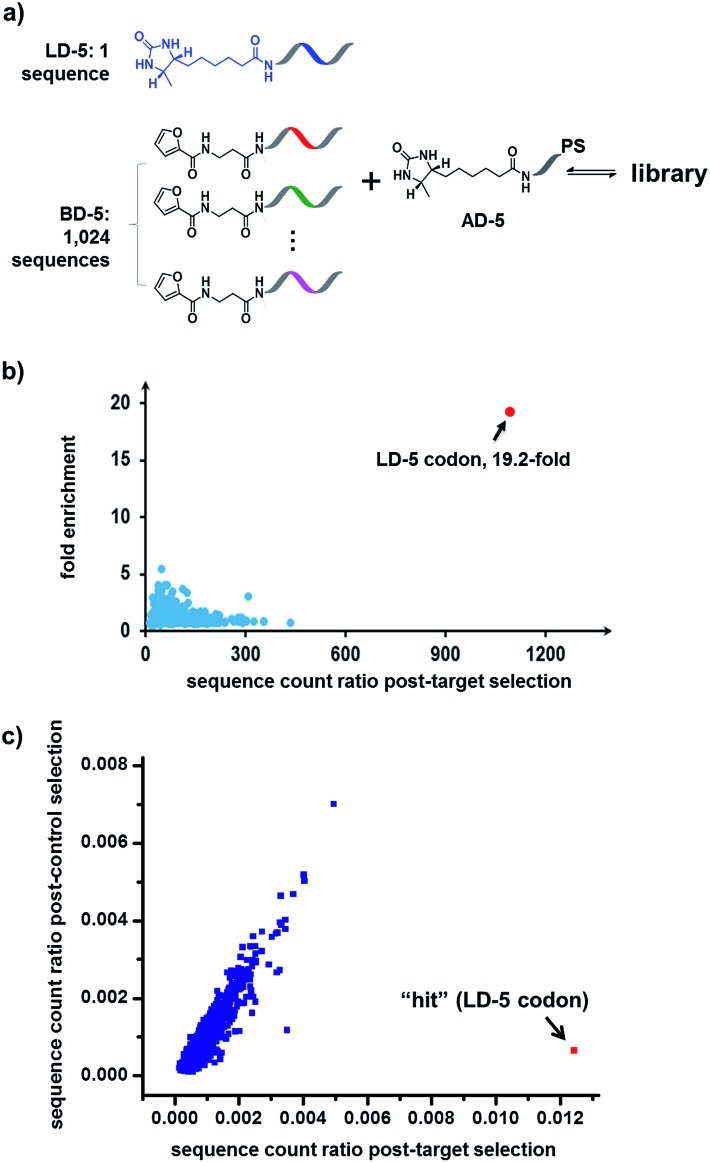
Fig. 8. (a) Components of the 1025-member library. The library was selected against SA with the same procedure as that for Fig. 6, except Illumina® sequencing was used. (b) Plot of the fold enrichment versus sequence count after the target selection. Fold enrichment = (post-target selection fraction)/(post-control selection fraction). (c) Plot of sequence count ratios after the control selection (no protein added) versus count ratios after the target selection (with SA). Sequence ratio = (sequence count)/(total sequence count of the library). Each dot represents the DNA sequence corresponding to a library member. The “hit” containing the desired LD-5 codon is highlighted in red. LD-5: 0.19 nM; BD-5: 200 nM (total); AD-5: 300 nM; SA: 400 nM. The fold enrichments for the low-count library members vary widely due to statistical under-sampling. See the ESI for more details on the experimental procedure, data analysis and further discussion of the sequencing results.

Fig. 8