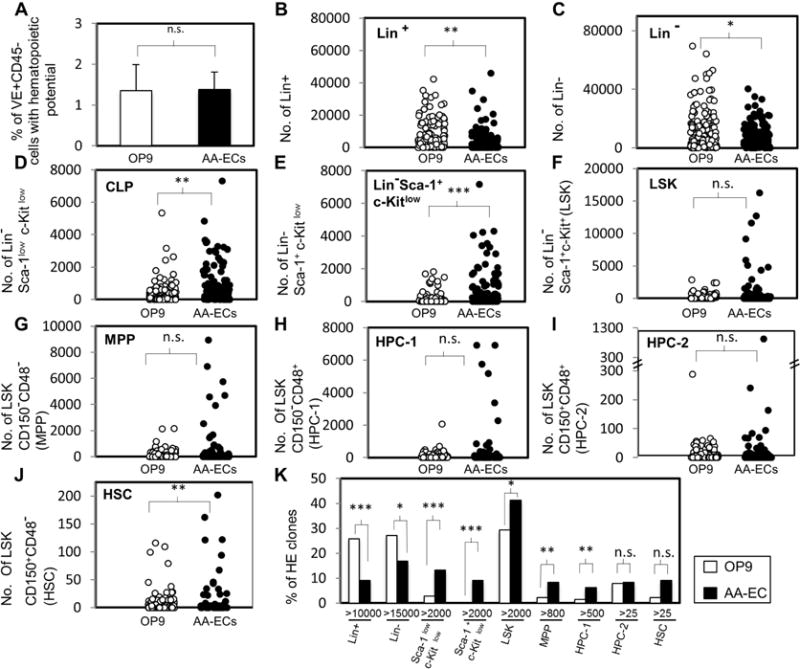
Figure 2. Ex vivo limiting dilution assay for hemogenic potential at E10.5 on OP9 or AA-EC cultures and quantitative analysis of phenotypically distinct hematopoietic populations generated by E10.5 VE+CD45− hemogenic endothelial clones.

A) The frequency of El 0.5 VE+CD45_ cells with hematopoietic potential In OP9 cell and AA-EC co-cultures is shown. See Supplemental Table 2 for further details. Bars represent the averages of at least four independent experiments. Four of them were performed in parallel. Standard deviations are indicated. B–J) Hematopoietic colonies generated by HE clones during OP9 cell or AA-EC co-culture were analyzed by flow cytometry similarly as in Fig.1. Each circle represents the absolute number of cells yielded by individual hemogenic endothelial clones (OP9/HE clones: n=140; AA-EC/HE clones: n=143). K) Graph indicates the % of clones that generated a “large numbers of cells”, which was defined as a value greater than that seen in 90% (90th percentile, P90) of colonies examined for a particular co-culture condition and hematopoietic population. This value was >10000 Lin+ cells, 15000 Lin− cells, 100 Lin− Sca-llow c-Kitlow cells (Sca-llowc-Kitlow), 400 Lim Sca-1+ c-Kitlow cells (Sca-1+ c-Kitlow), 2000 LSK cells, 800 MPP cells, 500 HPC-1 cells, 25 HPC-2 cells, or 25 HSC. A–J) White-filled circles or bars account for endothelial clones plated and co-cultured with OP9 stromal cells. Black-filled circles or bars represent clones plated and co-cultured on AA-ECs. *, P < 0.1; **, P < 0.05; ***, P< 0.001; n.s.: not statistically significant.
