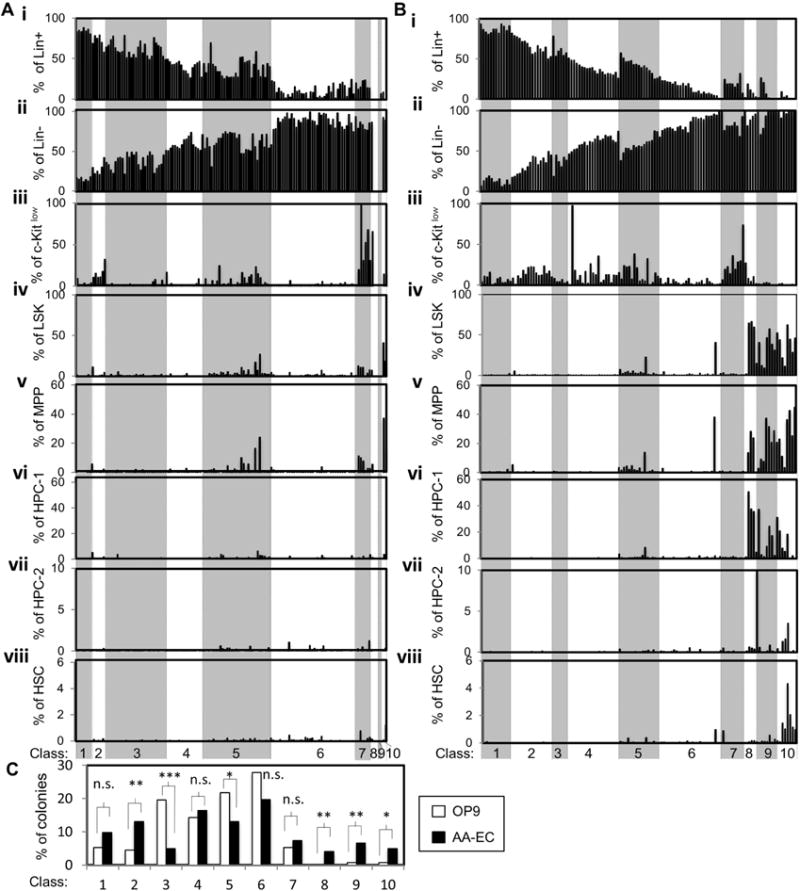
Figure 3. Hemogenic endothelial clones classified by phenotypic hematopoietic output.

The phenotypic hematopoietic output of individual colonies from OP9/ or AA-EC/ HE co-cultures shown on Fig. 2 were assigned to one of ten classes (Class 1–10) that progress from more differentiated (Class 1) to more multi-potent (Class 10). See Suppl. Figs. 2–3 for precise Class definitions and representative flow cytometry plots. A) Classification of colonies emerging from HE clones co-cultured with OP9 cells. B) Classification of colonies emerging from HE clones co-cultured with AA-ECs. For (A) and (B), each bar represents a single hematopoietic colony. Bars in the same position in each panel (i–viii) refer to the same colony. C) Summary of the % of HE clones belonging to each Class. White bars represent clones collected from OP9 co-cultures and black bars represent clones collected from AA-EC co-cultures. *, P < 0.1; **, P < 0.05; ***, P< 0.001; n.s.: not statistically significant.
