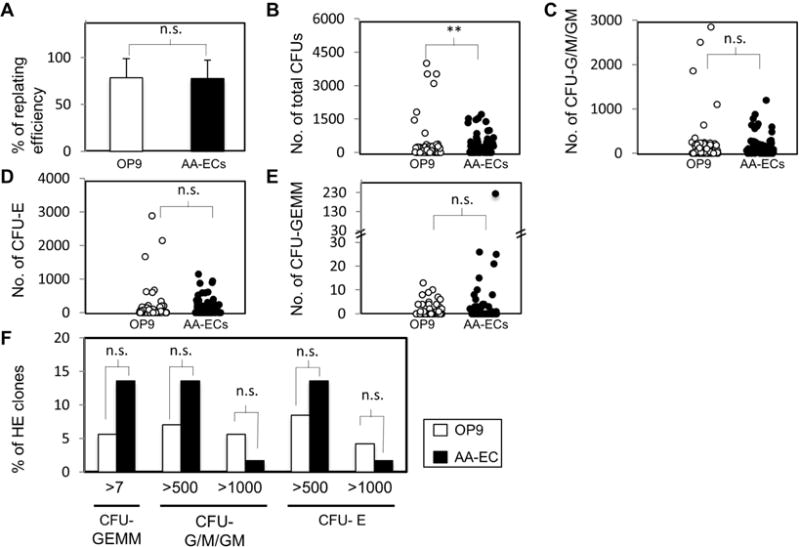
Figure 4. CFU output of hemogenic endothelial clones.

A) % of individual colonies from OP9/ or AA-EC/ HE co-cultures capable of re-plating into semi-solid media supplemented with hematopoiesis promoting cytokines. Bars represent the average from five independent experiments, three of them performed in parallel. A total of 86 and 59 colonies were plated respectively from OP9/ and AA-EC/ HE co-cultures. Error bars indicate standard deviation. B–F) Colonies with replating-ability were further analyzed for their CFU type composition. B) Total absolute number of CFUs generated by colonies collected from OP9 or AA-EC HE co-cultures. C) Total absolute number of CFU-G/M/GM (granulocyte and monocyte colonies) generated by colonies collected from OP9/ or AA-EC/ HE co-cultures. D) Total absolute number of CFU-Es (erythroid) generated by colonies collected from OP9/ or AA-EC/ HE co-cultures. E) Total absolute number of CFU-GEMMs (mixed colonies of granulocytes, erythrocytes, macrophages, and megakaryocytes) generated by colonies collected from OP9/ or AA-EC/ HE co-cultures. For B–E, each circle represents the output of an independent colony collected from OP9 (white circles) and AA-EC (black circles) co-cultures. F) % of primary colonies that generated >seven CFU-GEMMs, 500 or 1000 CFU-G/M/GMs, and more than 500 or 1000 CFU-Es. *, P < 0.1; **, P < 0.05; ***, P< 0.001; n.s.: not statistically significant.
