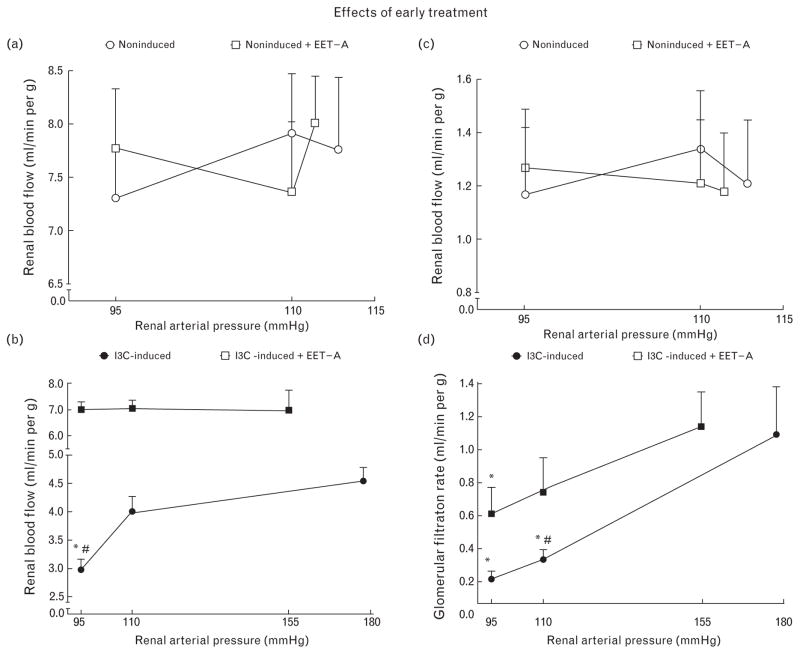
FIGURE 8.
The relationship between renal arterial pressure and renal blood flow (a and b), and glomerular filtration rate (c and d). The data for indole-3-carbinol induced and noninduced Cyp1a1-Ren-2 transgenic rats and effects of epoxyeicosatrienoic acid analog treatment are shown. *P < 0.05 versus basal values. #P < 0.05 versus the corresponding value (at the same time point) in the other group.

