
Figure 1.
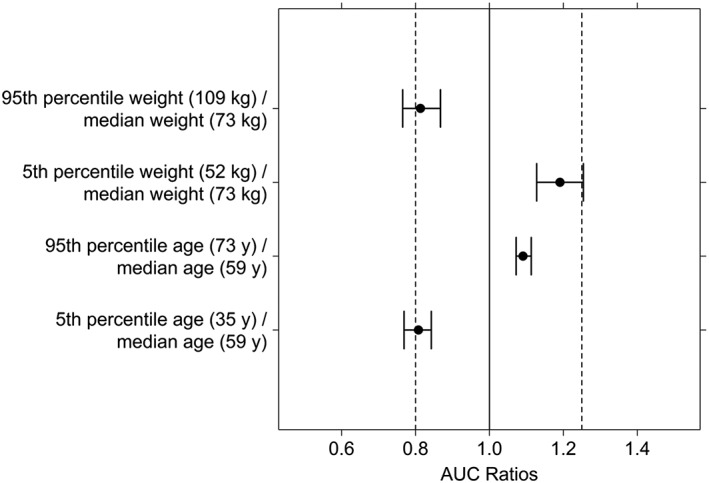
Forest plot of the effect of age and body weight on the AUC of cediranib. Filled circles and error bars represent median and 90% confidence interval for the ratio of AUC at the 5th or 95th percentile of the covariate over that at the median value of the covariate