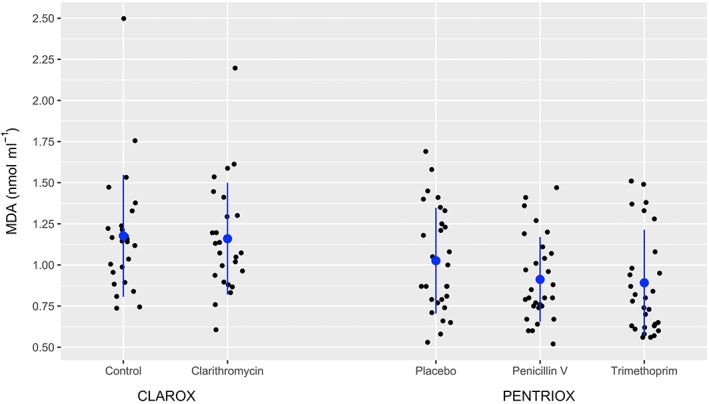
Figure 4.

Values of plasma malondialdehyde (MDA; solid) for each participant after treatment. The data are further denoted as mean (blue circle) and standard deviation (blue line). There was no significant difference in MDA, when treatment with clarithromycin, penicillin V, and trimethoprim was compared to control/placebo
