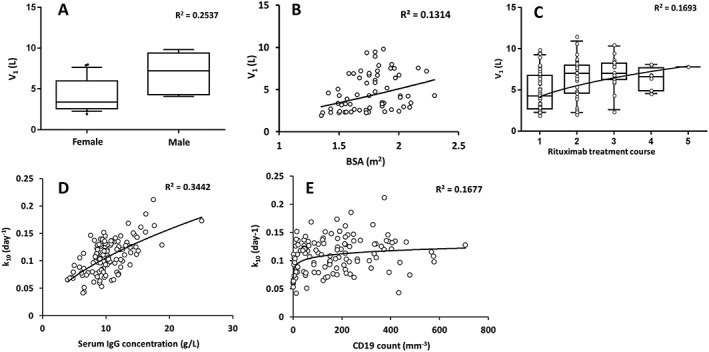
Figure 2.

Individual volume of distribution (V1, top) and elimination rate constant (k10, bottom) estimates vs. covariates: (A) sex, (B) body surface area and (C) rituximab treatment course on V1, and (D) serum IgG concentrations and (E) CD19 counts on k10. Open circles are observed values, lines are correlation lines, Horizontal lines of boxplots represent, from bottom to top, , 5th, 25th, 50th, 75th and 95th percentiles of pharmacokinetics parameters
