Figure 2.

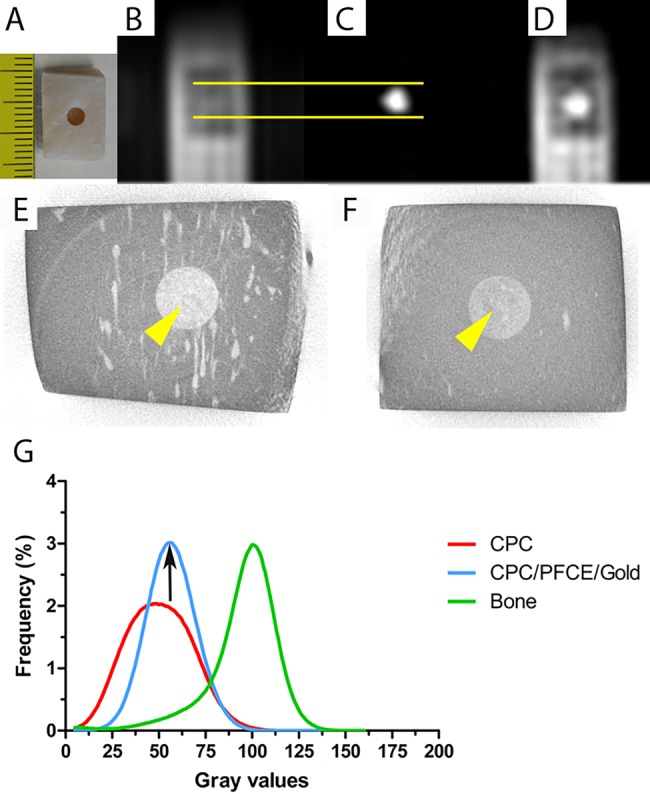
In vitro MRI and CT imaging of a bone block obtained from pig jaw. In (A) the morphological representation of the bone block. In (B) and (C) 1H and 19F ZTE MR images of CPC/PFCE/gold composite obtained at 11.7 T. Note that the 19F signal corresponds to the cylindrical defect in the 1H ZTE image as highlighted by the yellow lines. (D) ZTE MR images of 19F overlaid on those of 1H ZTE. In (E) and (F) the gray scale 2D images from the μCT of the pig block filled with the CPC composite are shown without (E) and with (F) contrast agents. The yellow arrows indicate the implanted material. In (G) the graph from the gray values distribution calculated for a defined volume of interest (n = 3). Note that the signal intensity is elevated and much more defined.
